
Four homes sold in the Old Town Key West area, fewest ever. The 5-year (2018 - 2022) average of homes sold in January is twelve. Each of the four homes sold had at least three bedrooms as larger homes carry over their dominance from 2022. In January 2022, thirteen homes sold and in January 2021, twenty homes sold. On Prices, aided by a $4M sale, the average sold price in January was $2.3M at an average of $1181 per square foot. In 2022, there were 145 sales at an average sold price of $1.71M and $1169 per sqft.
________________________________________________________________________________________
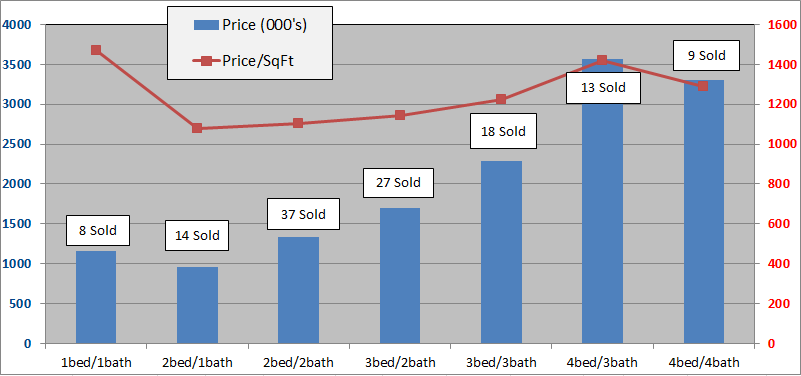
The below charts show sales of the seven most popular bed/bath combinations in Old Town Key West from January 1, 2014 to January 31, 2023. When there is a difference between total home sales and the sum of sales in the below seven charts it is because of a sale of, for instance, a 2bed/3bath or 3bed/1bath house or a house with more than four bedrooms.
These charts are for single family homes sold south and west of White St. and cover the six neighborhoods of The Meadows, Old Town North and South, Bahama Village, Truman Annex and Casa Marina but not Sunset Key. You can view a map of the six neighborhoods of Old Town here. An analysis of the number of sales and sale prices for each of these six neighborhoods for all of 2022 is here.
1 Bedroom/1 Bathroom
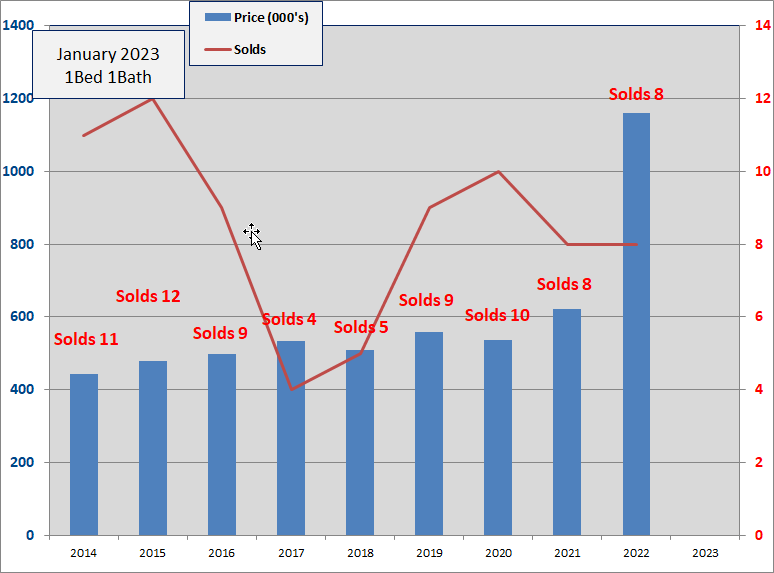
- Zero,1Bed/1Bath homes have sold in the Old Town area thru 1/31/2023. Eight homes sold in 2022 at an average number of days to sell of 60 days.
- The 2022 average sale price of $1.16M was the highest ever, up 86% over 2021 and is 495% above the 2011 low.
- Presently, there are three 1/1's for sale priced between $749,000 and $949,000.
- The average size of the 2022 homes sold was 789 sq.ft., well above average.
- The average sale price per sqft. of $1471 was up 36% over 2021 and was the highest ever
2 Bedroom/1 Bathroom
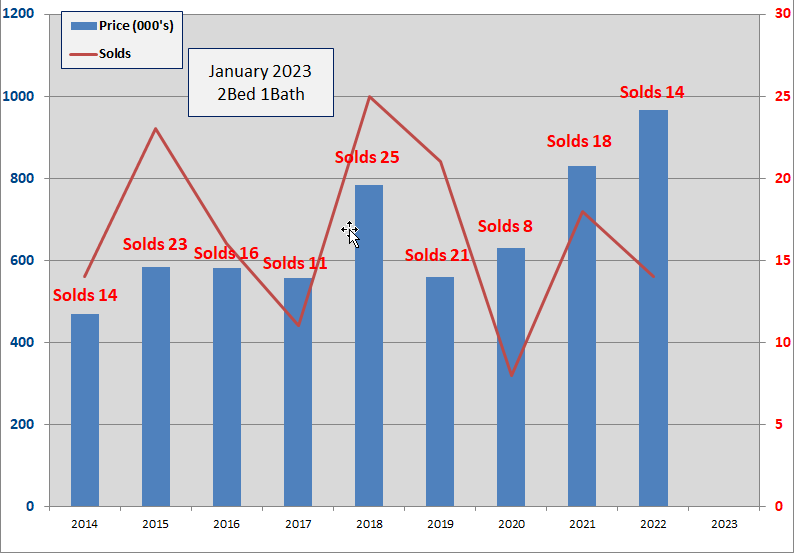
- Zero, 2Bed/1Bath homes have sold in the Old Town area thru 1/31/2023. In 2022, fourteen homes sold at an average of 42 days to sell.
- The 2022 average sold price was $966K, up 16% over 2021 and 191% above the 2011 low.
- The sold price per square foot in 2022 of $1079 was up 27% over 2021 and was the highest ever for a 2/1.
- There are three 2/1 homes for sale priced between $1.06M and $1.45M.
- Eighteen 2/1 homes sold in 2021, eight in 2020.
- Since 2009, 2Bed/1Bath homes have been the 3rd most popular selling home in Old Town with 243 sales.
2 Bedroom/2 Bathroom

- Zero, 2Bed/2Bath homes have sold in the Old Town area thru 1/31/2023. In 2022, thirty-seven homes sold at an average of 45 days to sell.
- The 2022 average sold price of $1.34M was up 12% over 2021 and was 215% above the low in 2009.
- Four 2/2's are for sale, priced between $1.3M and $2.5M.
- The 2022 average Sold price per sqft was $1103, up 14% over 2021.
- Since 2009, 2Bed/2Bath homes have been the biggest sellers in Old Town Key West with 429 sold.
3 Bedroom/2 Bathroom
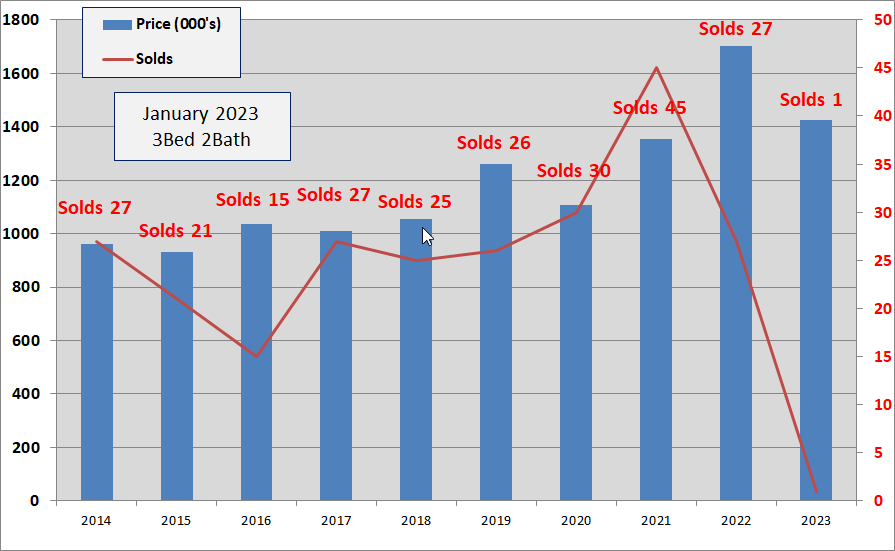
- One, 3Bed/2Bath home has sold in the Old Town area thru 1/31/2023. The number of Days to sell is 203 Days.
- The Sold price of $1.425M is up 16% below 2022 and is 209% above the 2009 low.
- The sold price per sqft. is $997, down 13% from 2022.
- Twenty-seven 3/2 homes sold in 2022, 3rd most ever.
- Since 2009, 3Bed/2Bath homes have been the 2nd biggest sellers in Old Town, exceeding twenty sales every year since 2013 except in 2016. Total sales since 2009 is 333 sales.
3 Bedroom/3 Bathroom

- Zero, 3Bed/3Bath homes have sold in the Old Town area thru 1/31/2023. In 2022, 18 homes sold at an average of 40 Days, fastest ever.
- The 2022 average sold price of $2.29M was up 28% over 2021 and was 210% above the 2010 low.
- The 2022 average Sold price per sqft. of $1223 was up 22% over 2021.
- Forty-one homes sold in 2021, nineteen homes sold in 2020.
- Since 2009, 3Bed/3Bath homes have been the fourth biggest seller in Old Town Key West with 277 sales
4 Bedroom/3 Bathroom
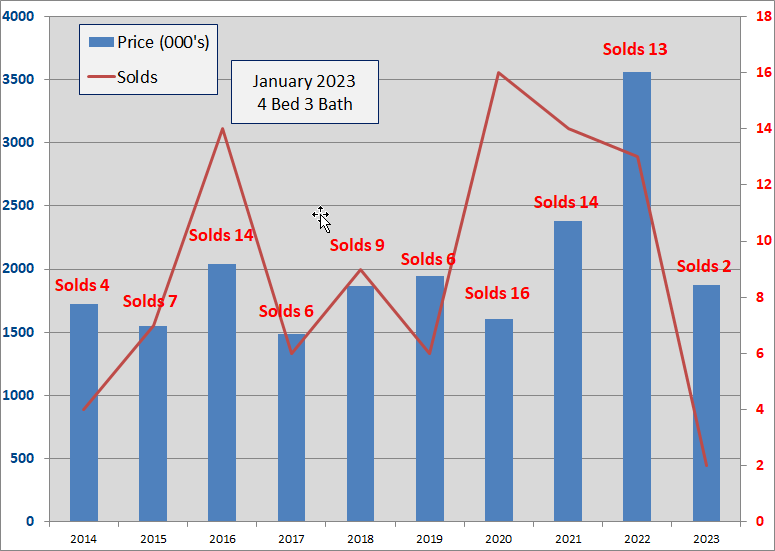
- Two, 4bed/3bath homes have sold in the Old Town area thru 1/31/2023 at an average of 45 Days to sell. In 2022, 13 homes sold at an average of 66 days to sell.
- The 2023 average sold price of $1.875M is down 47% from 2022 which was $3.56M, highest ever. The $1.875M is 122% above the 2009 low.
- The 2023 average sales price per sqft of $1322 is down 7% from 2022.
- There are four 4/3 homes for sale between $2.4 and $3.9M
4 Bedroom/4 Bathroom

- One, 4Bed/4Bath home has sold in the Old Town area thru 1/31/2023 at 27 days to sell. In 2021, 18 homes sold and in 2022, 9 homes sold.
- The 2023 sold price of $4M up 21% over 2022 and is up 259% over the 2009 low.
- The 2023 sold price per sq.ft. of $1104 is down 14% from 2022.
- Since 2003, the average number of annual sales is six, with eighteen in 2021, two in 2020 and five in 2019.
- Despite the choppy number of sales, price action between 2018 - 2012 has been steady between $2.4M - $2.5M.
Conclusion
The good news is, a rising stock market should keep cash buyers happy, retreating inflation and interest rates should keep finance buyers happy and the indefinite postponement of a contentious short-term rental issue should keep owner/investors happy. Baring any new shocks to the US economy, sales in Old Town Key West should hit 144 - 148 for the year. Recap:
- In 2019 there were 144 sales.
- In 2020 there were 142 sales
- In 2021 there were 234 sales - a record year.
- In 2022 there were 145 sales.
Inventory has risen to 60 homes for sale in the MLS, highest since May 2021. Historically, the strongest months for Closings are March, April and May, meaning buyers are most active in February and March. There presently are 11 Contingent and 6 Pending in the pipeline which should carry us through February.
What about prices? In 2022, each Quarter for the year except the 4th Quarter set a record high average sales price for that Quarter. Will sellers give any ground in their List Price in 2023? For 2022, average Days on Market ranged from 35 - 66 days (Depending on Bed/Bath configuration). If Days on Market starts to move up, that will indicate the period of "pent-up buyers" is ending and sellers' commitment to sale price will be tested.
If you have any comments or questions, please contact me here.
Welcome to 2023.