Like everyone, Key West suffered a 50% drop in residential sales prices from a peak in late 2006 through the end of 2010. Then, in 2011, Key West average sales prices for residential property; single family homes, condos, townhouses and duplexes, rose a modest 10%. But, the 1st Qtr 2012 was flat to down as the number of sales and prices faltered when compared to 2010 and 2011, themselves already low. Also, 1st Qtr 2012 Pendings were low, signally a probably poor 2nd Qtr to follow. Yet - not so fast - 2nd Qtr 2012 boomed!
Here's a look at 2nd Qtr 2012 number of sales and average sales prices as compared to 2010 and 2011.
In Key West, in 2010, there were 128 residential sales in the 2nd Qtr (Apr - Jun). In 2011 there were 142 sales. In 2012, in the 2nd Qtr, there were 160 sales.
The average sales price for 2nd Qtr sales in 2010 was $470,000. In 2011 it was $559,000. In 2012, in the 2nd Qtr, it was $512,000.
So, whereas the number of sales 2012 vs 2010 has increased 25%, the average sales price, 2012 vs.2010, has increased only 9%.
In the 2nd Qtr of 2012, Key West average monthly number of residential sales of 53, was:
- 39% more than the monthly average for 2010
- 35% more than the monthly average for 2011
- 25% more than the monthly average for the 2nd Qtr of 2010 and
- 13% more than the monthly average for the 2nd Qtr of 2011.
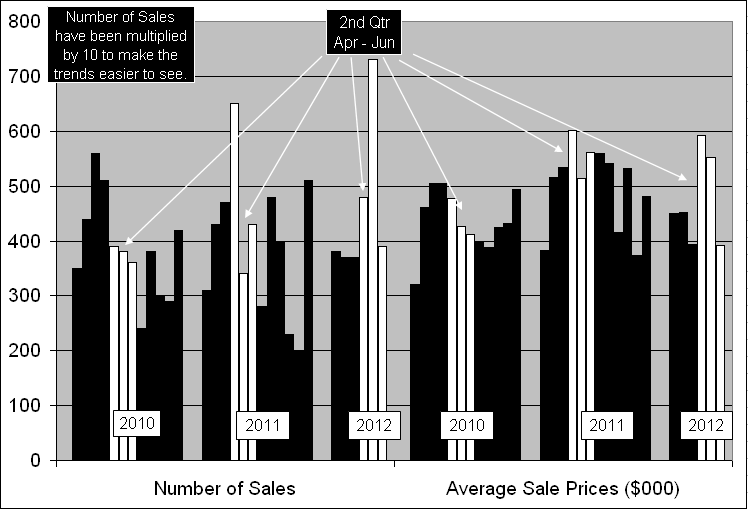
In the 2nd Qtr of 2012, the Key West average monthly residential sales price of $512,000 was:
- 17% more than the average monthly sales price for 2010
- 2% less than the average monthly sales price for 2011
- 9% more than the monthly average for the 2nd Qtr of 2010 and
- 8% less than the monthly average for the 2nd Qtr of 2011.
What does all of this mean? A flat start for 2012. An up 2nd Quarter. What about the rest of 2012?
First, lets look at another data source.
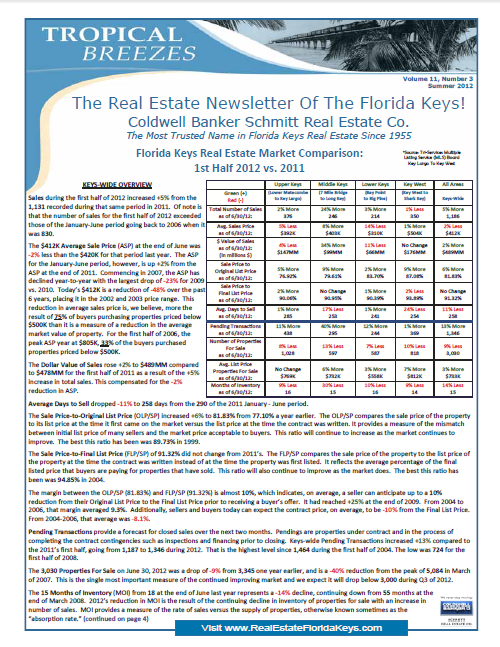
Every quarter my company, Coldwell Banker Schmitt Real Estate Company, produces a Quarterly Newsletter. This data-filled report provides MLS derived information about sales and prices from Key Largo to Key West and includes all real estate companies, not just Coldwell Banker Schmitt. The newsletter provides year over year comparisons so you can see the Big Picture for your area (To read the entire newsletter, click here Newsletter or below).
In addition to the data in Coldwell Banker Schmitt’s newsletter, there are insights to marketing and historical information about how the Keys were developed. Key West data includes all sales of all non-commercial properties, including multi-unit buildings, land and boat slips, whereas my chart above is only residences. Please take a moment to read the newsletter and if you like it let me know and I’ll get it to you every quarter.
Here’s some detailed information about the success areas not covered in the newsletter that are specific to Old Town Key West:
- TWENTY, 2bed/2bath single family homes have sold in Old Town thru June 30, 2012 at an average sales price of $608,000, UP 32% over 2011. Price per sqft was up 33% to $535 per sqft. The twenty sales thru June 30th exceeds the total number sold in 2011.
- ELEVEN, 3bed/2bath single family homes have sold in Old Town thru June 30, 2012 at an average sales price of $623,000, down 3% from 2011. While the average sales price is still down 39% from its peak in 2005, it is up 35% from its bottom in 2009.
- FIFTEEN, 3bed/3bath single family homes have sold in Old Town thru June 30, 2012 at an average sales price of $941,000, up 4% over 2011. Fifteen is the highest number of 3bed/3bath sold since tracking began in 2000. Also, the sales price and the price per sqft of $507 are the HIGHEST since 2005.
- A complete rundown of Old Town sales before and after the Bubble can be read here.
Which brings us back to, what’s up for the rest of 2012?
In Old Town, from April 1 to June 30, 2012
- There were 46 sales of single family homes with the sale of 11 single family homes in a Pending status. So 11 Pending sales means there are approximately 3 weeks of sales in the pipeline.
- There were 36 sales of condos, townhouses and duplexes with the sale of 10 of the same in a Contingent status. So 10 Contingent sales means there are approximately 3 weeks of sales in the pipeline.
Across the board, Key West future sales remain spotty. Distressed properties; Foreclosures and Short Sales, still exert downward pressure on prices and are keeping many sellers on the sidelines. There are enough Contingents and Pendings to propel sales into the 3rd Quarter but inventory will stay down.
Every Realtor in town has a pocket of Buyers who are ready to BUY that special property at an honest price. NO give aways, just a price that reflects the fair market value.
What should you do if you are selling your home?

My recommendation is that you should definitely hire a Realtor who has a Premium Marketing Plan that taps all the marketing tools; internet, social media, print and personal contact, to sell your home. Hire a Realtor who does his homework before he sits down with you are your table, listens to what are your goals and answers directly your questions.
Let’s get together and get your house sold.
If you have any comments, please contact me here.