February's 21 sales was the highest for any February on record, was the 3rd month in a row of 20 or more sales and the 6th month in a row where monthly sales exceeded the 5 year (2016 - 2020) average number of sales for that month. The 5 year average for February sales is 9. The 5 year average of January plus February sales is 19. In 2019, Jan+Feb was 24. In 2020, Jan+Feb was 19. In 2021, Jan+Feb is 41! On Prices, the average sale price for February was $1.64M. In January it was $1.685M - the highest average monthly sale prices since October 2019. The average sale price per square foot thru Feb is $864, 11% above end of 2020. Wow.
____________________________________________________________________________________
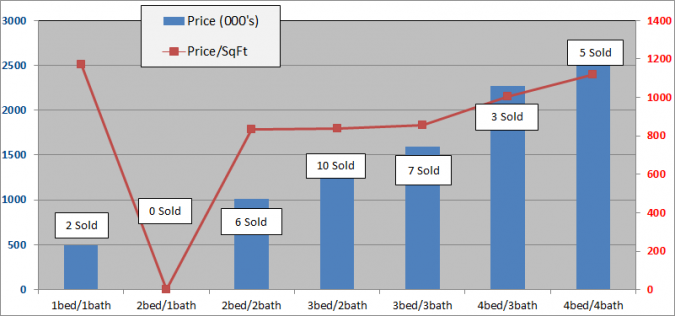
The below charts show sales of the seven most popular bed/bath combinations in Old Town Key West from January 1, 2012 to February 28, 2021. When there is a difference between total home sales and the sum of sales in the below seven charts it is because of a sale of, for instance, a 2bed/3bath or 3bed/1bath house or a house with more than four bedrooms.
These charts are for single family homes sold south and west of White St. and cover the six neighborhoods of The Meadows, Old Town North and South, Bahama Village, Truman Annex and Casa Marina but not Sunset Key. You can view a map of the six neighborhoods of Old Town here. A neighborhood by neighborhood analysis of full year 2020 sales, is here.
The seven bed/bath combinations below contain enough sales to measure and evaluate trends after the 2004-2006 real estate Bubble.
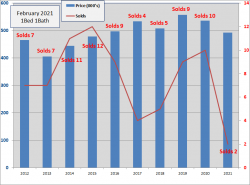
1 Bedroom/1 Bathroom
- Two, 1Bed/1Bath homes have sold in the Old Town area thru 2/28/2021. The average number of days to sell is 39 days.
- There are four 1/1 homes for sale priced between $599K and $995K.
- The 2021 average sale price of $493,000 is 8% less than the average sale price for 2020 and 153% above the 2011 low.
- In 2020 there were ten sales, the best since 2015 when twelve homes sold.
- The average size of the 2021 homes sold is 420sq.ft., well below average. The average sale price per sqft. of $1173 is 40% above 2020.
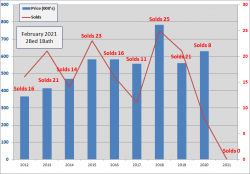
2 Bedroom/1 Bathroom
- Zero, 2Bed/1Bath homes have sold in the Old Town area thru 2/28/2021.
- In 2020, the average Sold price of $629,000 was 12% above 2019 which at $560K was down 29% from 2018. The $629K was 89% above the 2011 low.
- Five 2/1 homes are for sale with prices from $629K to $925K.
- Twenty-one homes sold in 2019, eight in 2020.
- Since 2009, 2Bed/1Bath homes have been the 3rd most popular selling home in Old Town with 211 sales
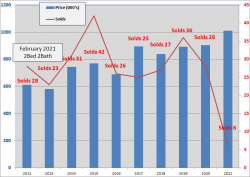
2 Bedroom/2 Bathroom
- Six, 2Bed/2Bath homes have sold in the Old Town area thru 2/28/2021. The number of Days to sell is 157 Days.
- The sold price of $1,010,000 is 12% higher than the 2020 end of year price of $905, which was the highest average sold price since 2006 and is 138% above the low in 2009.
- Six 2/2's are for sale, priced between $740K and $1.349M.
- The 2021 average Sold price per sqft is $833, up 8% from 2020. In 2019 the average was $724, in 2018 the average was $747.
- Since 2009, 2Bed/2Bath homes have been the biggest sellers in Old Town Key West with 355 sales
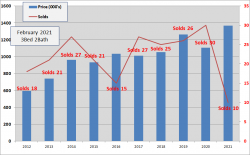
3 Bedroom/2 Bathroom
- Ten, 3Bed/2Bath homes have sold in the Old Town area thru 2/28/2021. The average number of Days to sell is 47 Days.
- The average Sold price of $1,367,000 is up 24% over 2020 and is 196% above the 2009 low.
- The average sold price per sqft. is $838, up 14% over 2020.
- Twenty-six homes sold in 2019, thirty in 2020, the most ever.
- Since 2009, 3Bed/2Bath homes have been the 2nd biggest sellers in Old Town, exceeding twenty sales every year since 2013 except in 2016. Total sales since 2009 is 271 sales
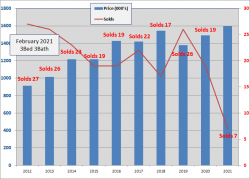
3 Bedroom/3 Bathroom
- Seven, 3Bed/3Bath homes have sold in the Old Town area thru 2/28/2021. The average number of Days to sell is 102 Days.
- The 2021 average sold price of $1.597M is 7% above 2020 which was 8% over 2019. $1.588M is 115% above the 2010 low.
- The average Sold price per sqft. of $858 is down 8% from 2020 and is the second highest recorded for 3/3 homes.
- Twenty-six homes sold in 2019 and nineteen in 2020.
- Since 2009, 3Bed/3Bath homes have been the fourth biggest seller in Old Town Key West with 225 sales.
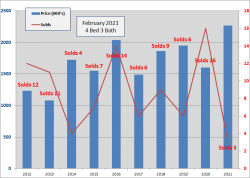
4 Bedroom/3 Bathroom
- Three, 4bed/3bath home sold in the Old Town area thru 2/28/2021. The number of days to sell is 153 days.
- The average sold price of $2.267M, is up 41% from 2020 and is 168% above the 2009 low.
- Sixteen 4/3's sold in 2020, more than 2019 and 2018 combined. Sixteen solds is the highest annual total since seventeen sold in 2008!
- The 2021 sales price per sqft of $1006 up 37% over 2020.
- There are six homes for sale, ranging in price from $1.439M to $3.3995M.
- Number of sales and sales prices for 4Bed/3Bath homes is very choppy though there has been an erratic up trend in average sale price since 2013.
4 Bedroom/4 Bathroom
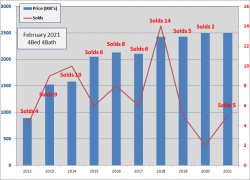
- Five, 4Bed/4Bath homes have sold in the Old Town area thru 2/28/2021. Average number of Days to sell is 24 days. Two homes sold in 2020 at an average days on market of 114 days.
- There are four 4/4's for sale ranging from $1.9M to $3.2M.
- The 2021 average sold price of $2.499 is identical to 2020 which was up 3% over 2019 and is up 124% over the 2009 low.
- The 2021 average sold price per sq.ft. of $1119 is also the same as 2020.
- Since 2003, average number of annual sales is six, with fourteen in 2018, five in 2019 and two in 2020. Despite the choppy number of sales, price action has been steady, $2M - $2.4M.
Conclusion
Forty-one sales in 59 days. In 2019 there were 144 sales. In 2020 there were 142 sales. The 41 sales thru February 2021 is the same as 28% of sales in 16% of the time.
March, April and May are historically the biggest months for Closings. As of today, there are 34 Contingent and 14 Pending contracts. That's three months of Closings right there.
Indoor-outdoor living, work remote Key West yet fly to anywhere with ease, tranquil lifestyle removed from metropolitan anxieties, historic architecture, clean air and water, multi media arts.
Pick one. Pick them all.
If you have any comments or questions, please contact me here.
Good luck!
