
Three single family homes sold in the Old Town area of Key West in November, the fewest number of sales since September 2017 and the 5th month in a row of below average, single digit monthly sales. January-November 2022 total of sales are 138, which is 4% behind the 5-year (2017-2021) average of January-November sales (144) but is 13% ahead of the full year number of sales for 2020 and 3% ahead of the full year number of sales for 2019. Number of days to sell remains at record lows for all bed/bath combinations with many homes "Sold" before they officially hit the MLS. Demand continues to exceed Supply which is, finally, increasing from historic lows. On Prices, the average sold price in November of $1.18M was the second lowest of the year and November's average sold price per square foot of $675 dropped the average sold price per sqft for the year to $1156, which still is up 21% over 2021.
________________________________________________________________________________________
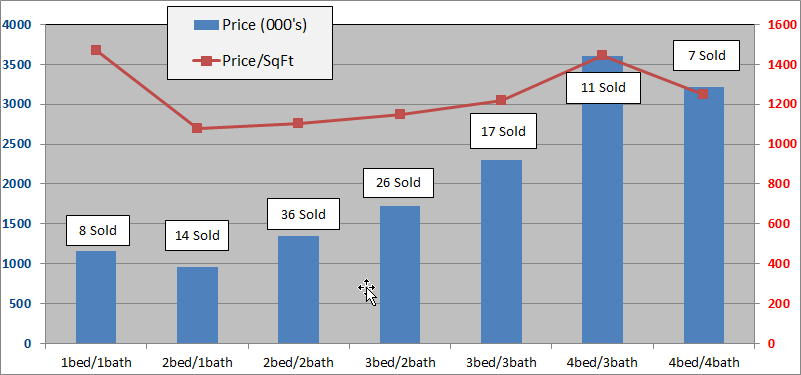
The below charts show sales of the seven most popular bed/bath combinations in Old Town Key West from January 1, 2013 to November 30, 2022. When there is a difference between total home sales and the sum of sales in the below seven charts it is because of a sale of, for instance, a 2bed/3bath or 3bed/1bath house or a house with more than four bedrooms.
These charts are for single family homes sold south and west of White St. and cover the six neighborhoods of The Meadows, Old Town North and South, Bahama Village, Truman Annex and Casa Marina but not Sunset Key. You can view a map of the six neighborhoods of Old Town here. An analysis of the number of sales and sale prices for each of these six neighborhoods for the 1st Half of 2022 is here.
1 Bedroom/1 Bathroom
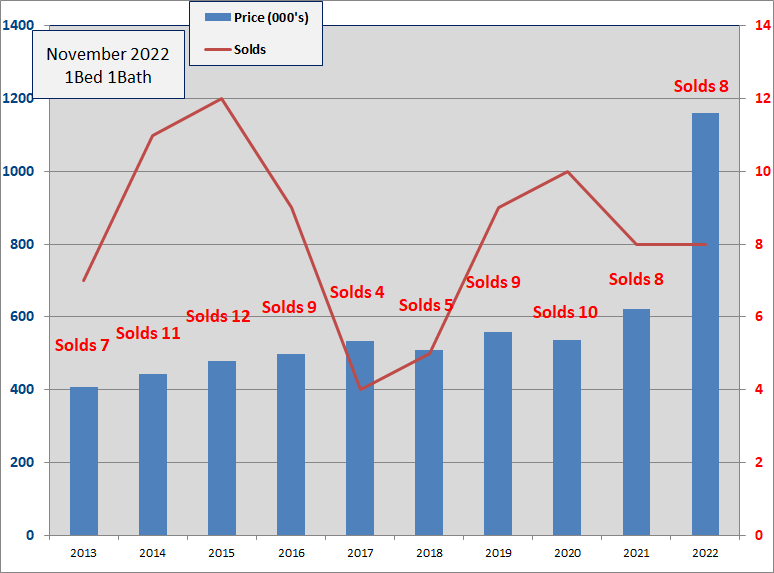
- Eight, 1Bed/1Bath homes have sold in the Old Town area thru 11/30/2022. The average number of days to sell is 60 days.
- The 2022 average sale price of $1.160M is the highest ever, up 86% over 2021 and is 495% above the 2011 low.
- Eight 1/1 homes sold in 2021, ten homes in 2020.
- The average size of the 2022 homes sold is 789 sq.ft., well above average.
- The average sale price per sqft. of $1471 is up 36% over 2021 and is the highest ever
2 Bedroom/1 Bathroom
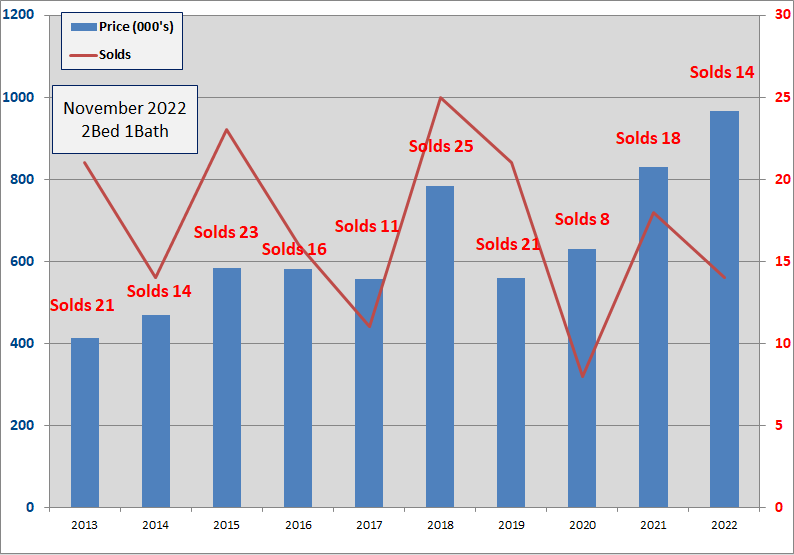
- Fourteen, 2Bed/1Bath homes have sold in the Old Town area thru 11/30/2022 at an average of 42 days to sell.
- The 2022 average sold price is $966K is up 16% over 2021 and 191% above the 2011 low.
- The sold price per square foot in 2022 of $1079 is up 27% over 2021 and is the highest ever for a 2/1.
- There are six 2/1 homes for sale priced between $995K and $1.4M.
- Eighteen 2/1 homes sold in 2021, eight in 2020.
- Since 2009, 2Bed/1Bath homes have been the 3rd most popular selling home in Old Town with 243 sales.
2 Bedroom/2 Bathroom
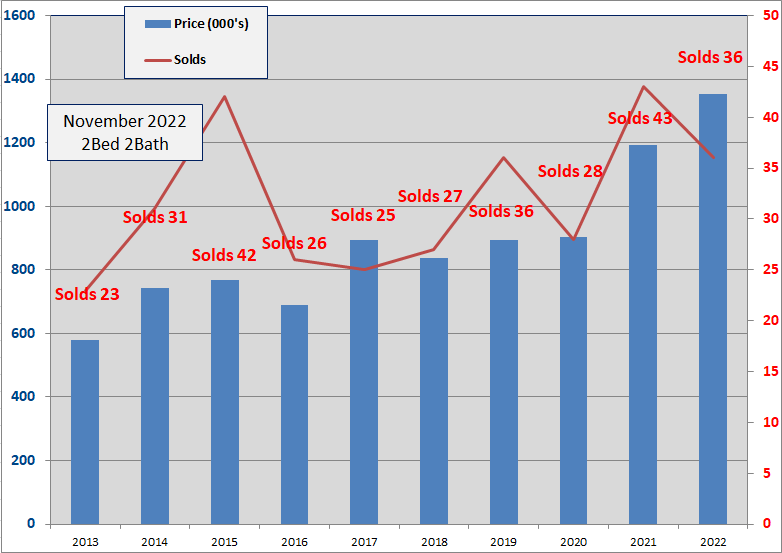
- Thirty-six, 2Bed/2Bath homes have sold in the Old Town area thru 11/30/2022. The average number of Days to sell is 46 Days. 43 homes sold in 2021 at an average of 58 Days.
- The 2022 average sold price of $1.355M is up 14% over 2021 and is 219% above the low in 2009.
- Three 2/2's are for sale, priced between $1.3M and $1.9M.
- The 2022 average Sold price per sqft is $1105, up 14% over 2021.
- Since 2009, 2Bed/2Bath homes have been the biggest sellers in Old Town Key West with 428 sold.
3 Bedroom/2 Bathroom
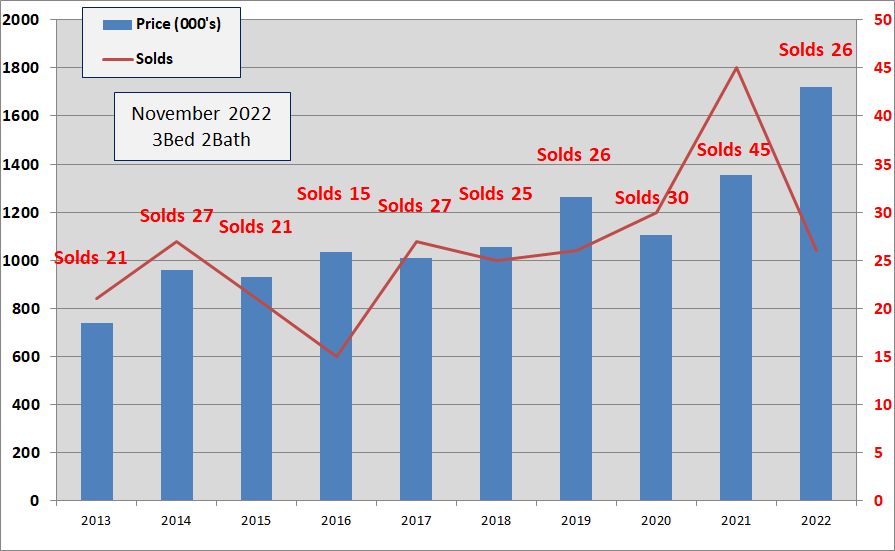
- Twenty-six, 3Bed/2Bath homes have sold in the Old Town area thru 11/30/2022. The average number of Days to sell is 34 Days.
- The average Sold price of $1.71M is up 27% over 2021 and is 273% above the 2009 low.
- The average sold price per sqft. is $1146, up 23% over 2021.
- Forty-five 3/2 homes sold in 2021, the most ever.
- Since 2009, 3Bed/2Bath homes have been the 2nd biggest sellers in Old Town, exceeding twenty sales every year since 2013 except in 2016. Total sales since 2009 is 332 sales.
3 Bedroom/3 Bathroom

- Seventeen, 3Bed/3Bath homes have sold in the Old Town area thru 11/30/2022. The average number of Days to sell is 37, quickest ever. In 2021, 41 homes sold, the most ever, at an average of 96 Days.
- The 2022 average sold price of $2.29M is up 28% over 2021 and is 211% above the 2010 low.
- The average Sold price per sqft. of $1219 is up 22% over 2021.
- Forty-one homes sold in 2021, nineteen homes sold in 2020.
- Since 2009, 3Bed/3Bath homes have been the fourth biggest seller in Old Town Key West with 276 sales
4 Bedroom/3 Bathroom

- Eleven, 4bed/3bath homes have sold in the Old Town area thru 11/30/2022 at an average of 66 Days to sell. In 2021, 14 homes sold at an average number of days to sell of 95 Days.
- The 2022 average sold price of $3.59M is the highest ever, up 51% over 2021 which was 49% above 2020 and is 326% above the 2009 low.
- The 2022 average sales price per sqft of $1442 is up 43% over 2021 and is the highest ever.
- There are four 4/3 homes for sale between $2.25 and $3.7M
4 Bedroom/4 Bathroom
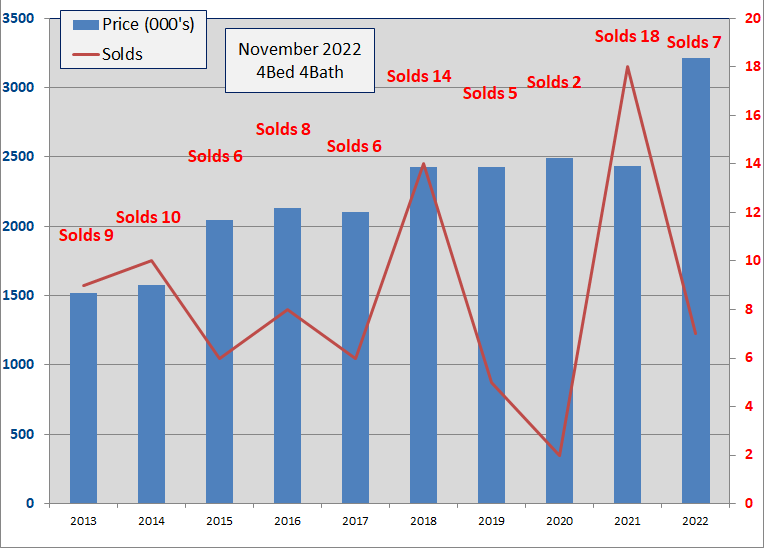
- Seven, 4Bed/4Bath homes have sold in the Old Town area thru 11/30/2022. Average number of Days to sell is 48 Days. In 2021, 18 homes sold, the most 4/4's solds EVER.
- The 2022 sold price of $3.21M is the highest ever, up 32% over 2021 and is up 188% over the 2009 low.
- The 2022 sold price per sq.ft. of $1250 is the highest ever, up 31% over 2021.
- Since 2003, the average number of annual sales is six, with eighteen in 2021, two in 2020 and five in 2019.
- Despite the choppy number of sales, price action between 2018 - 2012 has been steady between $2.4M - $2.5M.
Summary
November was the 5th month in a row of below aveage monthly sales; yet, Cash sales remain at a record 57% and inventory has risen from summer lows of 24 homes in the MLS for sale to 42 homes for sale in November - mostly larger three bedroom homes.
As I have noted many times before, many buyers of Key West homes are pre-retirement, high income earners who buy property as an asset to insert into their portfolio of investments. Many use their Key West property to generate part time income by renting the property on a vacation or monthly rental basis. This vacation/monthy rental process, where property can be rented on only a 30 day minimum/once per month basis, is under attack by partisan city politicians who, after abiding for this policy for years, now identify monthly rentals as a prime threat to the inventory of properties available for annual rentals.
In June 2022, City Hall first officially broached this idea of changing the rental minimum period to 180 days from 30 days and will be reviewing the applicable proposed Ordinance at the January 4th City Commission meeting (the agenda will likely not be posted until December 27th).
It's worth noting that -
- January-June sales were 21% ahead of the 5-year average of sales for January-June and,
- July-November sales are 47% behind the 5-year average of sales for July-November.
For years, new and existing property owners have legally used their property to generate part time income via monthly/30-day rentals or converted their property from annual rentals to monthly rentals, paying peanuts to the city for the license that authorizes monthly rentals and reaping enormous monthly rental rates. City Hall never blinked. Now, the city is acknowledging how monthly rentals impact the pool of annual rental properties. It remains to be seen what impact this new 6-month policy will have on either safeguarding or encouraging properties to be used as annual rentals or on the investment worthiness of Old Town property, especially in light of the record high valuations.
If you have any comments or questions, please contact me here.
Good luck.