
Ten single family homes sold in December, bringing the total for 2021 to a record breaking 234 sales; a whopping 89% above the 5-year (2016 - 2020) average of annual sales, 65% above 2020 and 63% above 2019. Every month except August and September had double digit sales. On Prices, the average sold price of $1.747M was up 36% over 2020! The average sold price per square feet for the year of $958 topped the 5-year average by 26% as each month May - December exceeded $930 per sqft.
________________________________________________________________________________________
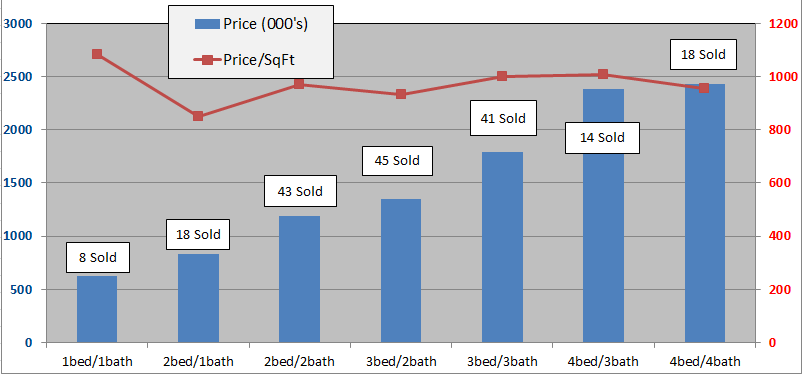
The below charts show sales of the seven most popular bed/bath combinations in Old Town Key West from January 1, 2012 to December 31, 2021. When there is a difference between total home sales and the sum of sales in the below seven charts it is because of a sale of, for instance, a 2bed/3bath or 3bed/1bath house or a house with more than four bedrooms.
These charts are for single family homes sold south and west of White St. and cover the six neighborhoods of The Meadows, Old Town North and South, Bahama Village, Truman Annex and Casa Marina but not Sunset Key. You can view a map of the six neighborhoods of Old Town here. An analysis of the number of sales and sale prices for each of these six neighborhoods in 2021 is here.
The seven bed/bath combinations below contain enough sales to measure and evaluate trends after the 2004-2006 real estate Bubble.
1 Bedroom/1 Bathroom

- Eight, 1Bed/1Bath homes have sold in the Old Town area thru 12/31/2021. The average number of days to sell is 147 days. (One house was on market for 745 days).
- The 2021 average sale price of $623,000 is up 16% from 2020 and is 219% above the 2011 low.
- In 2020 there were ten sales, the best since 2015 when twelve homes sold.
- The average size of the 2021 homes sold is 576 sq.ft., well below average. The average sale price per sqft. of $1081 is 29% above 2020
2 Bedroom/1 Bathroom
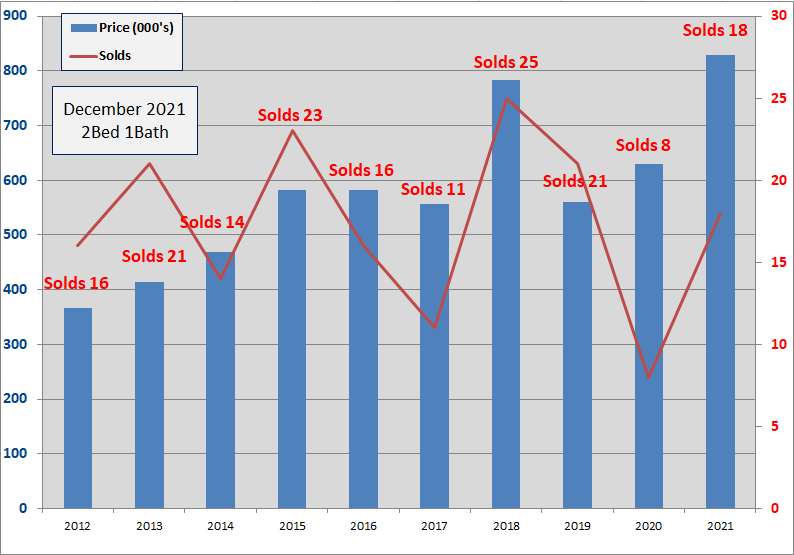
- Eighteen, 2Bed/1Bath homes have sold in the Old Town area thru 12/31/2021 at an average of 36 days to sell.
- The 2021 average Sold price of $830,000 is up 32% over 2020 which was up 12% over 2019. The $830K is 150% above the 2011 low.
- The average sold price per square foot of $850 is up 22% over 2020.
- Three 2/1 homes are for sale at $749K and $1.19M.
- Twenty-one 2/1 homes sold in 2019, eight in 2020.
- Since 2009, 2Bed/1Bath homes have been the 3rd most popular selling home in Old Town with 229 sales
2 Bedroom/2 Bathroom
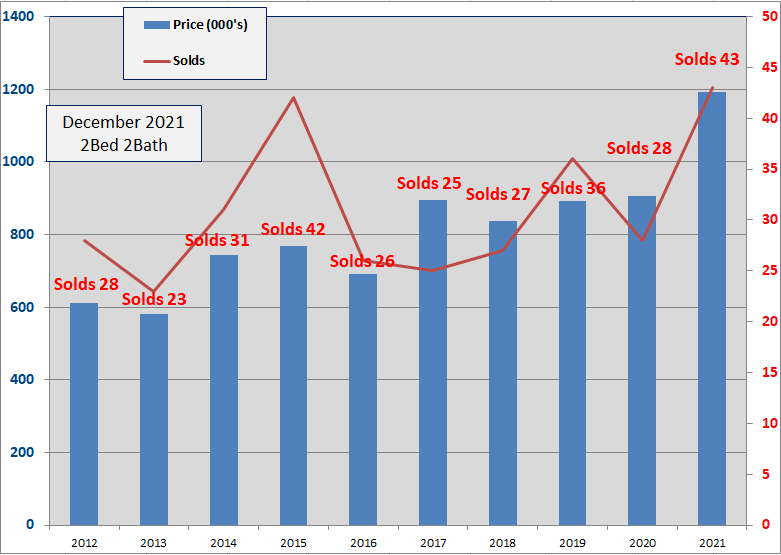
- Forty-three, 2Bed/2Bath homes have sold in the Old Town area thru 12/31/2021. The average number of Days to sell is 58 Days.
- The average sold price of $1.193M is up 32% over the 2020 end of year price of $905K and is the highest average sold price ever. $1.193M is 181% above the low in 2009.
- Five 2/2's are for sale, priced between $885K and $1.25M.
- The 2021 average Sold price per sqft is $969, up 26% over 2020. In 2020 the average was $768, in 2019 the average was $724.
- Since 2009, 2Bed/2Bath homes have been the biggest sellers in Old Town Key West with 392 sales
3 Bedroom/2 Bathroom
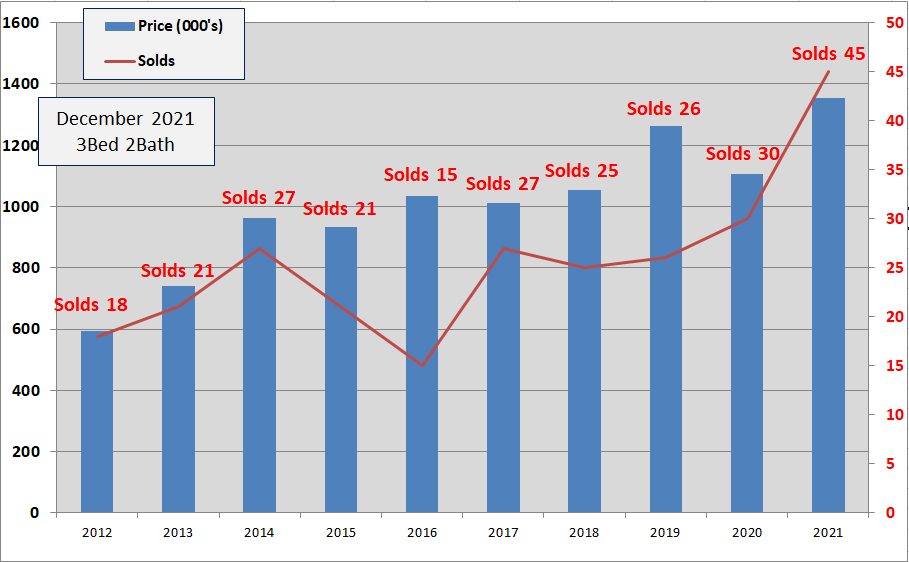
- Forty-five, 3Bed/2Bath homes have sold in the Old Town area thru 12/31/2021. The average number of Days to sell is 65 Days.
- The average Sold price of $1,354,000 is up 22% over 2020 and is 194% above the 2009 low.
- The average sold price per sqft. is $931, up 27% over 2020.
- Twenty-six homes sold in 2019, thirty in 2020. 45 sales is the most ever.
- Since 2009, 3Bed/2Bath homes have been the 2nd biggest sellers in Old Town, exceeding twenty sales every year since 2013 except in 2016. Total sales since 2009 is 306 sales.
3 Bedroom/3 Bathroom
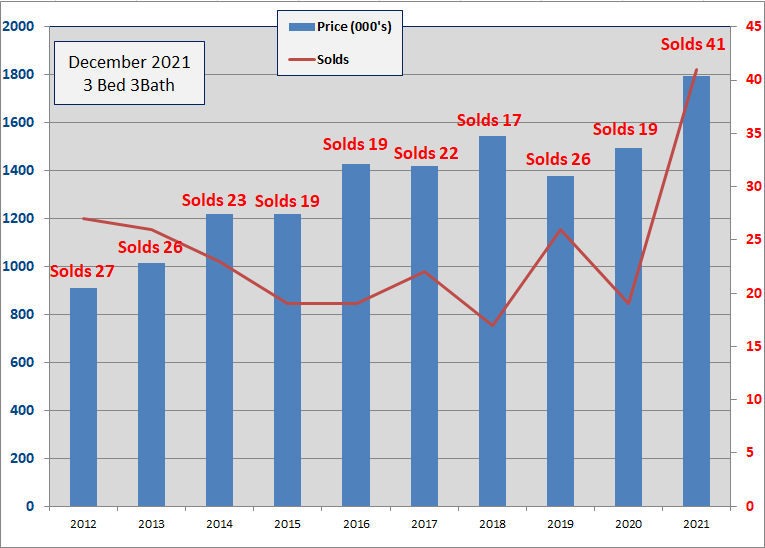
- Forty-one, 3Bed/3Bath homes have sold in the Old Town area thru 12/31/2021. The average number of Days to sell is 96 Days.
- The 2021 average sold price of $1.794M is up 20% over 2020 which was up 8% over 2019. $1.794M is 143% above the 2010 low.
- The average Sold price per sqft. of $999 is up 8% from 2020 and is the highest ever recorded for 3/3 homes.
- Twenty-six homes sold in 2019 and nineteen in 2020.
- Since 2009, 3Bed/3Bath homes have been the fourth biggest seller in Old Town Key West with 259 sales.
4 Bedroom/3 Bathroom

- Fourteen, 4bed/3bath homes have sold in the Old Town area thru 12/31/2021. The average number of days to sell is 95 days.
- The average sold price of $2.383M, is up 49% from 2020 and is 182% above the 2009 low. There are three homes for sale, priced from $2.4M to $4.7M.
- Sixteen 4/3's sold in 2020, more than 2019 and 2018 combined and was the highest annual total since seventeen sold in 2008.
- The 2021 sales price per sqft of $1009 is up 38% over 2020 and is the highest ever.
- Number of sales and sales prices for 4Bed/3Bath homes is very choppy though there has been an erratic up trend in average sale price since 2013.
4 Bedroom/4 Bathroom
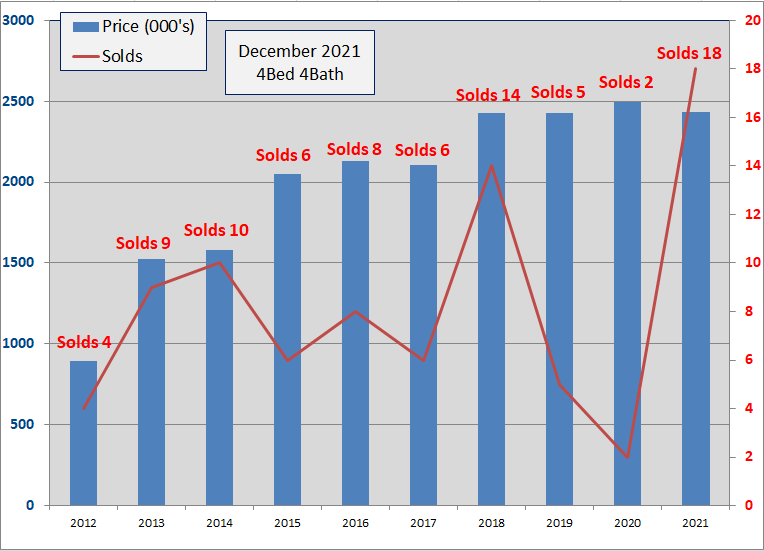
- Eighteen, 4Bed/4Bath homes have sold in the Old Town area thru 12/31/2021. Average number of Days to sell is 68 days. Eighteen Solds is the most 4/4 solds EVER.
- The 2021 average sold price of $2.432M is down 2% from 2020 which was up 3% over 2019 and is up 124% over the 2009 low.
- The 2021 average sold price per sq.ft. of $955 is down 15% from 2020.
- Since 2003, average number of annual sales is six, with fourteen in 2018, five in 2019 and two in 2020. Despite the choppy number of sales, price action has been steady, $2.1M - $2.5M.
Summary
Every house bedroom/bathroom combination benefited from the surge in home sales. Every bed/bath combination saw a double digit increase in the average sale price except 4bed/4bath which saw an average 2% decline.
Every bed/bath combination sold quicker with fewer Days on Market (DOM) except 1bed/1bath which saw an average 33% increase.
Even as inventory fell and remained at historic lows, down over 60% for the last four months of the year, sales were not significantly impacted. There are presently 28 homes For Sale in Old Town, normal inventory for January is 120+. Only four properties are listed below $1M. There are 20 Contingent and 8 Pending.
Conclusion

Record number of sales at record sold prices and record sold prices per square feet. 55% of all sales in 2021 were in Cash - another record.
The chart above shows this surge began in the 3rd Qtr 2020 with a rush of sales and prices. Sale prices moved measurably higher each following Quarter. Only a reduced inventory held back sales in the 3rd and 4th Qtr 2021.
2022? Buy the best you can afford but never buy what you can not afford to sell.
If you have any comments or questions, please contact me here.
Good luck!