Twenty-nine single family homes sold in the Old Town area in April, tops for the year, bringing the YTD total to 82 homes sold. Eighty-two sales is 105% above the 5-year (2017-2021) Jan - April total and while 82 sales does trail 2021's record of Jan - April sales, 82 sales is 91% over 2021 and 44% over 2019. On Prices, April's average sale price for the 29 sales was $1.88M, trailing only March's average of $2.14M. April's average sales price per square foot was a record $1179, bringing the YTD average to a record $1127.
________________________________________________________________________________________
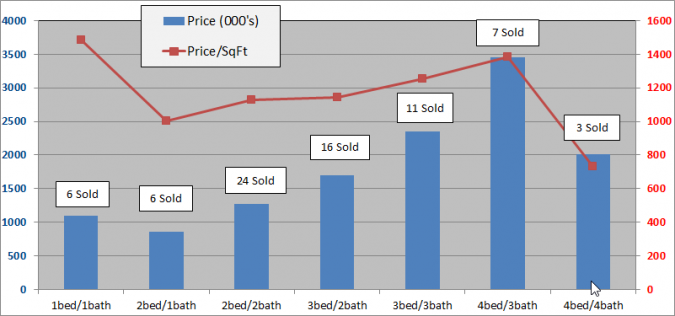
The below charts show sales of the seven most popular bed/bath combinations in Old Town Key West from January 1, 2013 to April 30, 2022. When there is a difference between total home sales and the sum of sales in the below seven charts it is because of a sale of, for instance, a 2bed/3bath or 3bed/1bath house or a house with more than four bedrooms.
These charts are for single family homes sold south and west of White St. and cover the six neighborhoods of The Meadows, Old Town North and South, Bahama Village, Truman Annex and Casa Marina but not Sunset Key. You can view a map of the six neighborhoods of Old Town here. An analysis of the number of sales and sale prices for each of these six neighborhoods for all of 2021 is here.
1 Bedroom/1 Bathroom
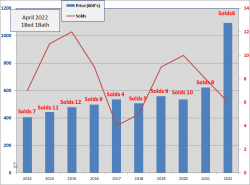
- Six, 1Bed/1Bath homes have sold in the Old Town area thru 4/30/2022. The average number of days to sell is 74 days.
- The 2022 average sale price of $1.09M is up 76% over 2021 and is 461% above the 2011 low.
- Eight homes sold in 2021, ten homes in 2020.
- The average size of the 2022 homes sold is 737 sq.ft., well above average.
- The average sale price per sqft. of $1473 is up 37% over 2021 and is the highest ever.
2 Bedroom/1 Bathroom
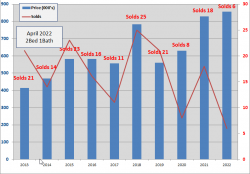
- Six, 2Bed/1Bath homes have sold in the Old Town area thru 4/30/2022 at an average of 54 days to sell.
- The 2022 average sold price is $856K up 3% over 2021. The $856K is 158% above the 2011 low.
- The sold price per square foot in 2022 of $1002 is up 18% over 2021 and is the highest ever for a 2/1..
- Three 2/1 home is for sale from $750K to $1.5M.
- Eighteen 2/1 homes sold in 2021, eight in 2020.
- Since 2009, 2Bed/1Bath homes have been the 3rd most popular selling home in Old Town with 235 sales
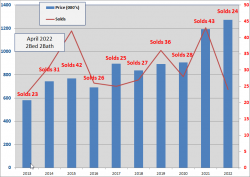
2 Bedroom/2 Bathroom
- Twenty-four, 2Bed/2Bath homes have sold in the Old Town area thru 4/30/2022. The average number of Days to sell is 30 Days. 43 homes sold in 2021 at an average of 58 Days.
- The 2022 average sold price of $1.272M is up 7% over 2021 and is the highest ever average sold price. $1.272M is 199% above the low in 2009.
- Seven 2/2's are for sale, priced between $949K and $2M.
- The 2022 average Sold price per sqft is $1126, up 16% over 2021.
- Since 2009, 2Bed/2Bath homes have been the biggest sellers in Old Town Key West with 416 sales
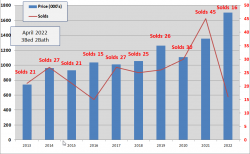
3 Bedroom/2 Bathroom
- Sixteen, 3Bed/2Bath homes have sold in the Old Town area thru 4/30/2022. The average number of Days to sell is 25 Days.
- The average Sold price of $1.7M is up 26% over 2021 and is the highest ever for a 3/2 home. The $1.7M is 269% above the 2009 low.
- The average sold price per sqft. is $1143, up 23% over 2021.
- Forty-five 3/2 homes sold in 2021, the most ever.
- Since 2009, 3Bed/2Bath homes have been the 2nd biggest sellers in Old Town, exceeding twenty sales every year since 2013 except in 2016. Total sales since 2009 is 322 sales.
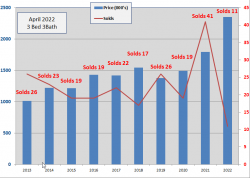
3 Bedroom/3 Bathroom
- Eleven, 3Bed/3Bath homes have sold in the Old Town area thru 4/30/2022. The average number of Days to sell is 43. In 2021, 41 homes sold, the most ever, at an average of 96 Days.
- The 2022 sold price of $2.35M is up 31% over 2021 and is 219% above the 2010 low.
- The average Sold price per sqft. of $1255 is up 26% over 2021 and is the highest ever recorded for 3/3 homes.
- Forty-one homes sold in 2021, nineteen homes sold in 2020.
- Since 2009, 3Bed/3Bath homes have been the fourth biggest seller in Old Town Key West with 270 sales.
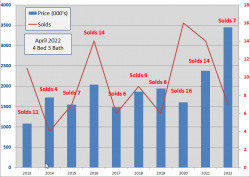
4 Bathroom/3 Bathroom
- Seven, 4bed/3bath homes have sold in the Old Town area thru 4/30/2022 at an average of 91 Days to sell. In 2021, 14 homes sold at an average number of days to sell of 95 Days.
- The 2022 average sold price is $3.45M, up 45% over 2021 and is 308% above the 2009 low.
- There is one home for sale, priced at $4.7M.
- The 2022 average sales price per sqft of $1384 is up 37% over 2021 and is the highest ever.
- Number of sales and sales prices for 4Bed/3Bath homes is very choppy though there has been an erratic up trend in average sale price since 2013.
4 Bedroom/4 Bathroom
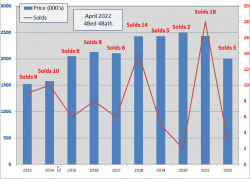
- Three, 4Bed/4Bath homes have sold in the Old Town area thru 4/30/2022. Average umber of Days to sell is 50 Days. In 2021, 18 homes sold, the most 4/4's solds EVER.
- The 2022 sold price of $2.1M is down 17% from 2021 and is up 80% over the 2009 low.
- The 2022 sold price per sq.ft. of $734 is down 23% from 2021.
- Since 2003, the average number of annual sales is six, with eighteen in 2021, two in 2020 and five in 2019. Despite the choppy number of sales, price action has been steady between $2.1M - $2.5M.
Conclusion
Real estate is a top performer/safe haven during inflation and investor/buyers with substantial market positions continue to convert stock into Key West real estate. Of the 29 sales in April, 18 were in Cash, raising Old Town Key West Cash sales YTD to 57%, highest percentage ever.
March, April and May are historically the three strongest months of the year for sales, accounting for 34% of annual sales. March and April 2022 have already exceeded the number of sales equal to that 34%. Yet, the total of 20 Contingent and Pending sales in the pipeline is a few contracts below the 6-month trendline so May and June could see a slight slowdown.
If you have any comments or questions, please contact me here.
Good luck.
