Fourteen homes sold in the Old Town Key West area in March, bringing the Q1 2023 total of sales to 29. Twenty-nine sales is the lowest since Q1 2018 and 28% below the 5-year (2018-2022) average for Q1 sales of 40 homes sold. On the plus side, after seven months (July 2022 - January 2023) of single digit monthly sales, both Feb and March 2023 recorded double digit sales, eleven and fourteen respectively. On Prices, the average sold price for the 29 homes sold was the highest ever at $2.41M. The average sales price per square foot also hit a new record of $1256 per sqft, up 7% over 2022 and 31% over 2021.
________________________________________________________________________________________
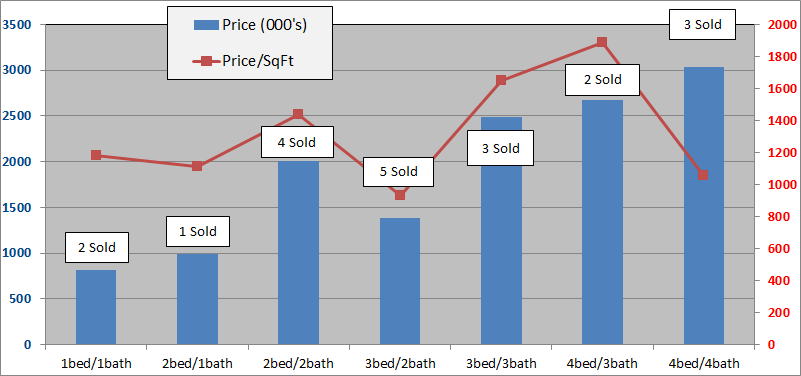
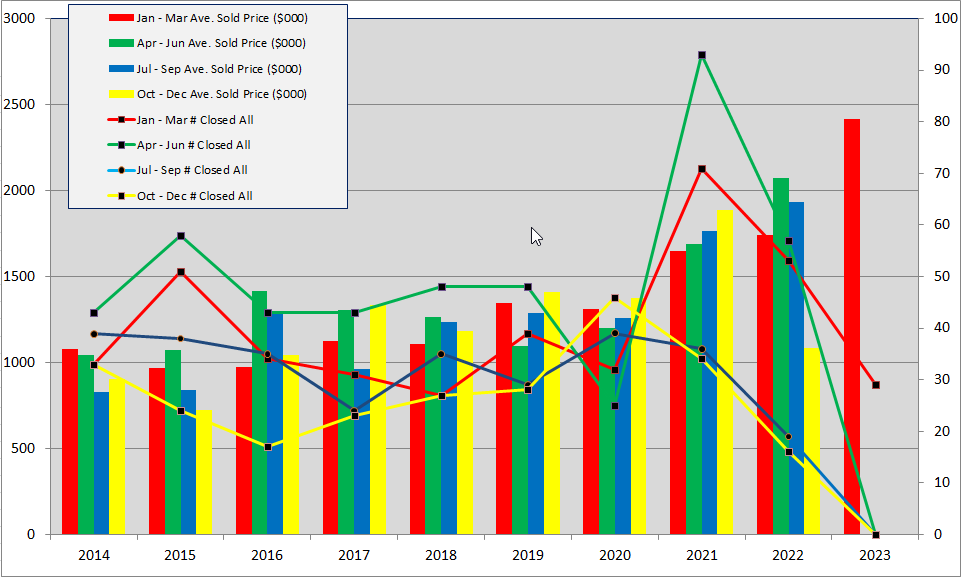
The below charts show sales of the seven most popular bed/bath combinations in Old Town Key West from January 1, 2014 to March 31, 2023. When there is a difference between total home sales and the sum of sales in the below seven charts it is because of a sale of, for instance, a 2bed/3bath or 3bed/1bath house or a house with more than four bedrooms.
These charts are for single family homes sold south and west of White St. and cover the six neighborhoods of The Meadows, Old Town North and South, Bahama Village, Truman Annex and Casa Marina but not Sunset Key. You can view a map of the six neighborhoods of Old Town here. An analysis of the number of sales and sale prices for each of these six neighborhoods for all of 2022 is here.
1 Bedroom/1 Bathroom

- Two,1Bed/1Bath homes have sold in the Old Town area thru 3/31/2023. Average days on market was 29 days. Eight homes sold in 2022 at an average number of days to sell of 60 days.
- The average Sold price for these two sales is $813K which is 317% above the 2011 low. In 2022, the average sale price for the 8 sales was of $1.16M, highest ever.
- There are Zero 1/1's for sale.
- The 2023 sales have an average size of 690 sqft at $1178 per sqft. In 2022, the average size was 789 sq.ft. and the average sale price per sqft. of $1471 was highest ever.
2 Bedroom/1 Bathroom

- One, 2Bed/1Bath home has sold in the Old Town area thru 3/31/2023. In 2022, fourteen homes sold at an average of 42 days to sell.
- The 2023 sold price of $995K is up 3% over 2022 and 200% above the 2011 low.
- The sold price per square foot in 2023 of $1110 is up 3% over 2022 which was 21% over 2021.
- There are four 2/1 homes for sale priced between $997K and $1.39M.
- Eighteen 2/1 homes sold in 2021, eight in 2020.
- Since 2009, 2Bed/1Bath homes have been the 3rd most popular selling home in Old Town with 244 sales.
2 Bedroom/2 Bathroom

- Four, 2Bed/2Bath homes have sold in the Old Town area thru 3/31/2023 with an average of 54 days on market. In 2022, thirty-seven homes sold at an average of 45 days to sell.
- The average 2023 Sold price of $2.01M is up 50% over 2022 and 373% above the low in 2009.
- Six 2/2's are for sale, priced between $995K and $2.345M.
- The 2023 average Sold price per sqft of $1439 is up 30% over 2022.
- Since 2009, 2Bed/2Bath homes have been the biggest sellers in Old Town Key West with 433 sold.
3 Bedroom/2 Bathroom
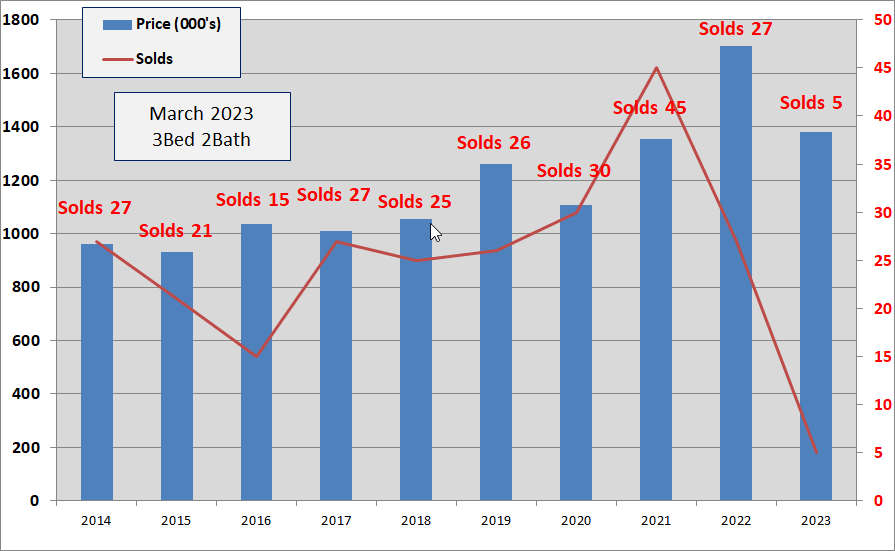
- Five, 3Bed/2Bath homes have sold in the Old Town area thru 3/31/2023. The average number of Days to sell is 103 Days.
- The average Sold price of $1.38M is down 19% from 2022 and is 199% above the 2009 low.
- The sold price per sqft. is $933, down 19% from 2022.
- Twenty-seven 3/2 homes sold in 2022, 3rd most ever.
- Since 2009, 3Bed/2Bath homes have been the 2nd biggest sellers in Old Town, exceeding twenty sales every year since 2013 except in 2016. Total sales since 2009 is 338 sales.
3 Bedroom/3 Bathroom

- Three, 3Bed/3Bath homes have sold in the Old Town area thru 3/31/2023. In 2022, 18 homes sold at an average of 40 Days, fastest ever.
- The 2023 average sold price of $2.48M is up 8% from 2022 and 236% above the 2010 low.
- The average Sold price per sqft. of $1650 is up 35% over 2022 and is the highest ever.
- Forty-one homes sold in 2021, nineteen homes sold in 2020.
- Since 2009, 3Bed/3Bath homes have been the fourth biggest seller in Old Town Key West with 280 sales
4 Bedroom/3 Bathroom

- Two, 4bed/3bath homes have sold in the Old Town area thru 3/31/2023 at an average of 14 Days to sell. In 2022, 13 homes sold at an average of 66 days to sell.
- The 2023 average sold price of $2.675M is down 25% from 2022 and is 217% above the 2009 low.
- The 2023 average sales price per sq.ft. of $1886, highest ever, is up 33% over 2022.
- There are seven 4/3 homes for sale priced between $2.1M and $3.9M
4 Bedroom/4 Bathroom
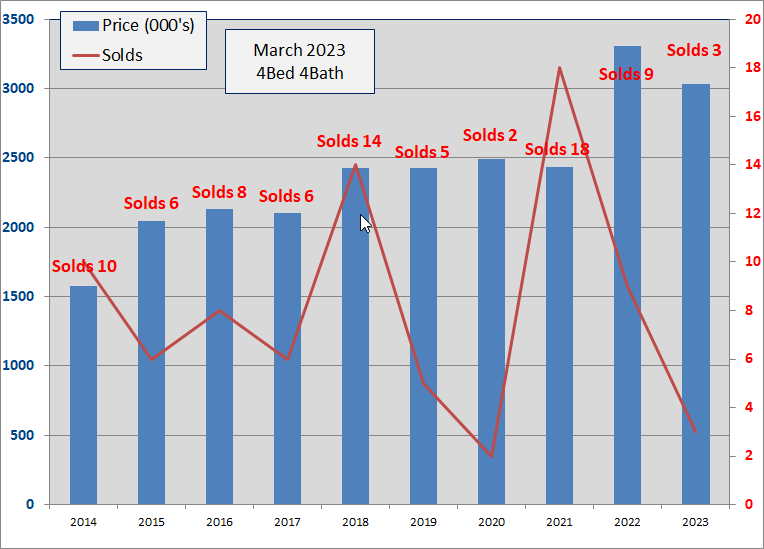
- Three, 4Bed/4Bath homes have sold in the Old Town area thru 3/31/2023 at an average of 52 days to sell. In 2022, nine homes sold at an average 49 days.
- The 2023 average sold price of $3.03M is down 8% from 2022 and is up 173% over the 2009 low.
- The 2023 sold price per sq.ft. of $1054 is down 18% from 2022.
- Since 2003, the average number of annual sales is six, with nine in 2022, eighteen in 2021 and two in 2020.
- Despite the choppy number of sales, price action has steadily climbed from $2.M in 2015 to $3.3M in 2022.
Summary
Last Spring when the Key West City Commission proposed strangling the local ordinance regulating short term 30-day vacation rentals, the real estate sales market responded with seven months, July 2022 - January 2023, of single digit monthy sales.
In early January, public opinion reversed this factless proposal, indefinitely postponing the effort. The Old Town sales market responded immediately with February and March both recording double digit sales. Inventory too has popped with sixty-six Old Town homes listed for sale, highest since July 2021.
Today's ten Pending and ten Contingent contracts indicate a continued renewal in the Old Town Key West market as we move into the historically two biggest months of the year. (April averages 20 sales and May averages 18 sales).
Conclusion
2021 was a record year for Old Town sales - 234. 2022 was a "slowdown" year with 145 sales but that was consistent with 2019, 144 sales and 2020, 142 sales.
Who is buying?
Higher interest rates have had a nominal impact on total sales but Cash sales have almost filled the void by leaping from a 5-year average of 54% to a Q1 2023 record of 76% of sales in Cash. When someone writes a $2.3M check for an Old Town home, that is a major commitment from the Buyer that also serves as a multi-year component to stabilize Key West's property tax base.
Who is selling?
Of the 29 sales in the 1st Qtr, 59% where of properties whose owner did not live in Key West. Historically, 62% - 64% of Old Town real estate is owned by out of towners. This percentage popped in 2021 as affluent buyers traded metro USA for Key West. How long this small-town bloom will stay on the rose I do not know but it does lead to the question I am most often asked - what will cause a slowdown in Old Town Key West real estate?
Affluence is mobile and contains expectations of service. Especially among the pre-retirement demographic presently buying 2nd and 3rd homes in Old Town, a reasonable level of service; such as has been rendered by the Buyer and rewarded with the ability to write a $2.3M check, is expected - at least desired. As public services falter - a complacency problem, or private services disappear - an affordable housing problem, affluence exercises it's mobility and relocates.
Where is Key West on the X/Y curve of expectation versus delivery? Like a large pot of water coming slowly to the boil, every day we inch closer to getting cooked.
If you have any comments or questions, please contact me here.
I hope your 2023 is delivering prosperity!