Thirteen single family homes sold in the Old Town Key West area in March bringing the total for 1st Qtr 2020 to 32 sales. For 1st Qtr 2019 there were 39 sales. 1st Qtr 2018 had 27 sales and 1st Qtr 2017 had 31 sales. The 5-year average (2015 - 2019) is 36 sales. In March, eighteen properties were Cancelled or Withdrawn, reducing inventory from 135 For Sale on March 1 to 124 on March 31. On Prices, the average sold price for March was above average at $1.43M. For the 1st Qtr the average sold price was $1.31M, less than 1% below 1st Qtr 2019. The Median sold price for 1st Qtr 2020 was $1.063M.
____________________________________________________________________________________
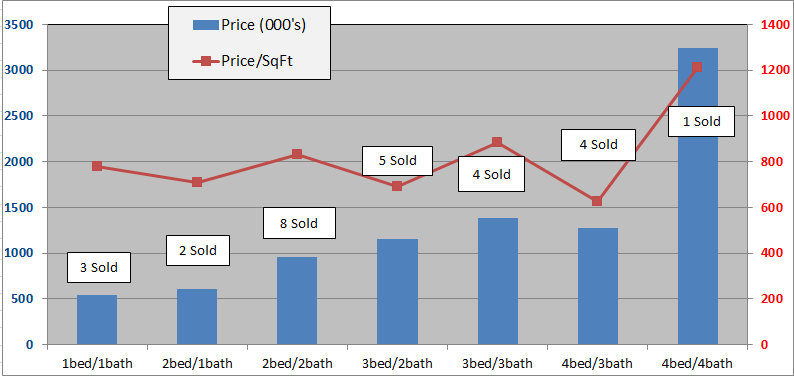
The below charts show sales of the seven most popular bed/bath combinations in Old Town Key West from January 1, 2011 to March 31, 2020. When there is a difference between total home sales and the sum of sales in the below seven charts it is because of a sale of, for instance, a 2bed/3bath or 3bed/1bath house or a house with more than four bedrooms.
These charts are for single family homes sold south and west of White St. and cover the six neighborhoods of The Meadows, Old Town North and South, Bahama Village, Truman Annex and Casa Marina but not Sunset Key. You can view a map of the six neighborhoods of Old Town here. An analysis of 2019 full-year sales, neighborhood by neighborhood, is here.
The seven bed/bath combinations below contain enough sales to measure and evaluate trends after the 2004-2006 real estate Bubble.
1 Bedroom/1 Bathroom
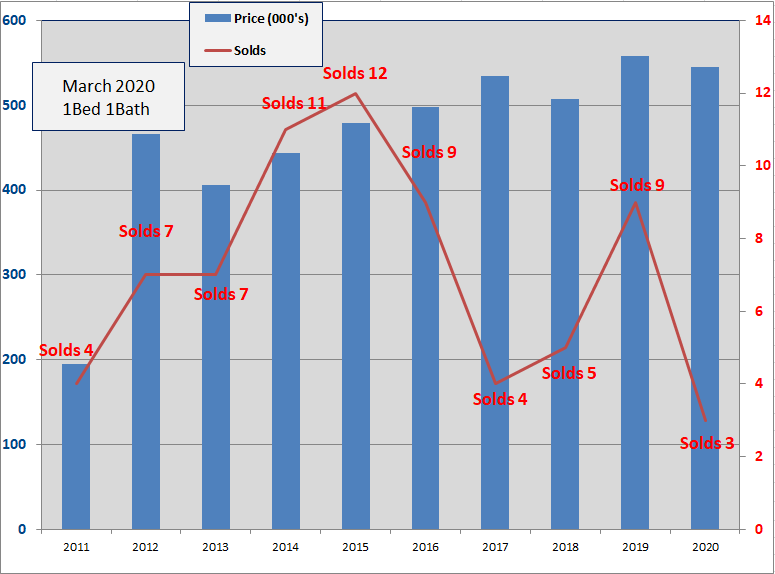
- Three, 1Bed/1Bath homes have sold in the Old Town area thru 3/31/2020. The average number of days to sell is 41 days.
- There are six 1/1 homes for sale from $583K to $879K.
- The 2020 average sale price of $545,000 is 2% less than the average sale price for 2019 and 179% above the 2011 low.
- The nine homes sold in 2019 tops total sales in 2018, 2017 and 2016. In 2015, twelve homes sold, but sales had fallen every year since.
- The average size of the 2020 homes sold is 700 sq.ft., above average. The average sale price per sqft. of $779 is 13% below 2019.
2 Bedroom/1 Bathroom
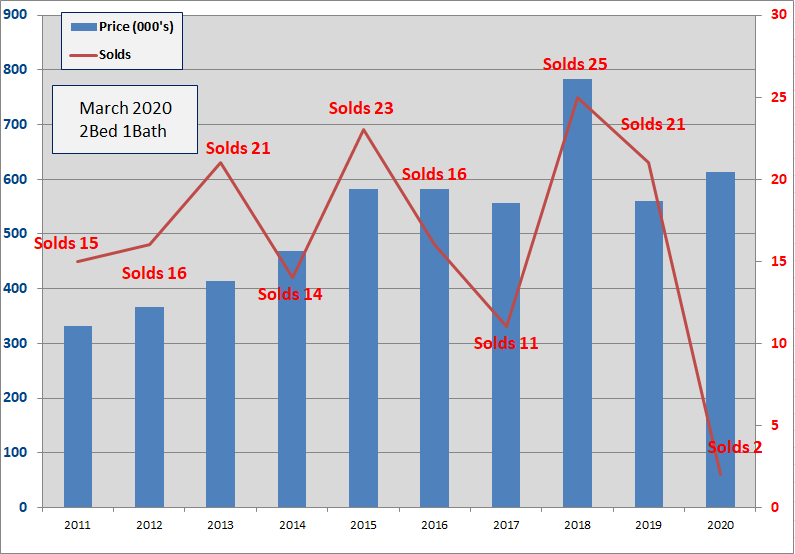
- Two, 2Bed/1Bath homes have sold in the Old Town area thru 3/31/2020. The average number of days to sell is 72 days.
- The 2020 average Sold price of $613,000 is 9% above 2019 which at $560K was down 29% from 2018. The $613K is 84% above the 2011 low.
- Six 2/1 homes are for sale with prices from $495K to $1.289M.
- Twenty-five homes sold in 2018 and twenty-one in 2019.
- Since 2009, 2Bed/1Bath homes have been the 3rd most popular selling home in Old Town with 205 sales.
2 Bedroom/2 Bathroom
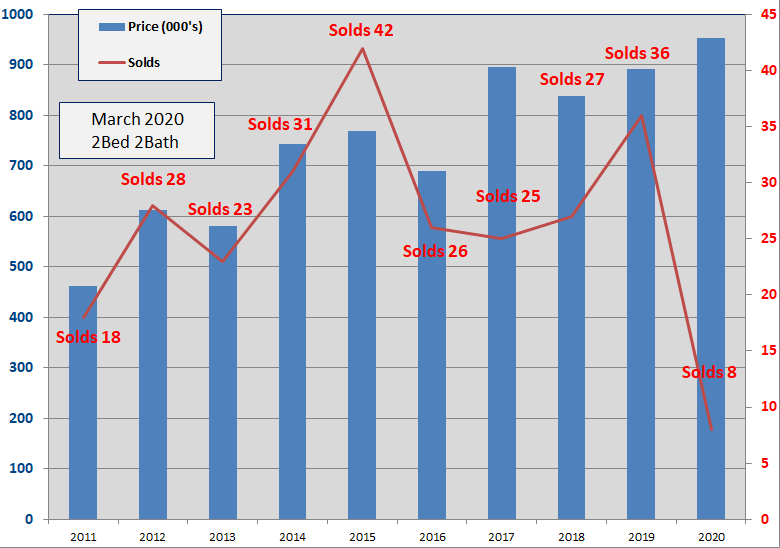
- Eight, 2Bed/2Bath homes have sold in the Old Town area thru 3/31/2020. The average number of Days to sell is 76 Days.
- The average sold price of $952,000 is 7% above 2019 and is 124% above the low in 2009.
- Nineteen 2/2's are for sale, priced between $610K and $1.439M.
- The 2020 average Sold price per sqft is $832, up 15% over 2019. In 2019 the average was $724, in 2018 the average was $747.
- Since 2009, 2Bed/2Bath homes have been the biggest sellers in Old Town Key West with 329 sales.
3 Bedroom/2 Bathroom
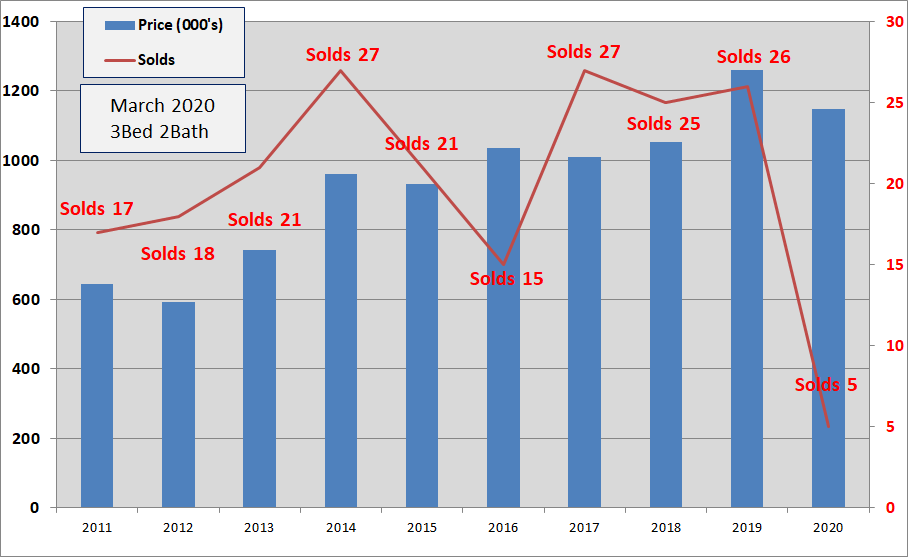
- Five, 3Bed/2Bath homes have sold in the Old Town area thru 3/31/2020. The average number of Days to sell is 112 Days.
- The average Sold price of $1,149,000 is down 11% from 2019 and is 149% above the 2009 low.
- The average sold price per sqft. is $692, down 11% from 2019.
- Twenty-seven homes sold in 2017, twenty-five in 2018 and twenty-six in 2019.
- Since 2009, 3Bed/2Bath homes have been the 2nd biggest sellers in Old Town with 236 sales.
3 Bedroom/3 Bathroom
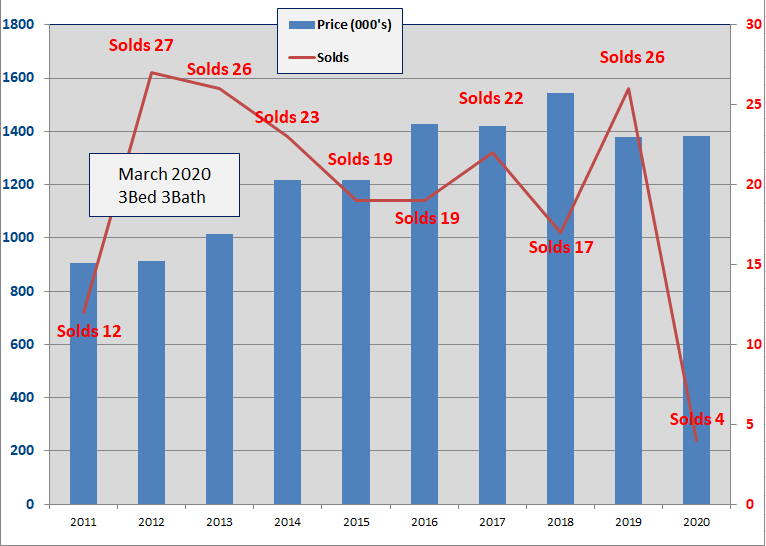
- Four, 3Bed/3Bath homes have sold in the Old Town area thru 3/31/2020. The average number of Days to sell is 37 Days.
- The 2020 average sold price of $1.383M is identical to 2019 which was 11% below 2018. $1.383M is 87% above the 2010 low.
- The average Sold price per sqft. of $885 is up 16% over 2019 and is the highest recorded for 3/3 homes.
- Seventeen homes sold in 2018 and twenty-six in 2019.
- Since 2009, 3Bed/3Bath homes have been the fourth biggest seller in Old Town Key West
4 Bedroom/3 Bathroom
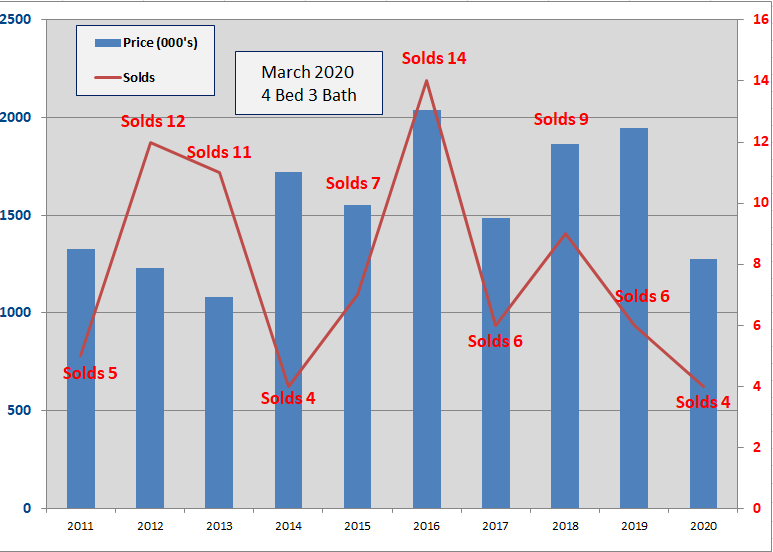
- Four, 4bed/3bath homes have sold in the Old Town area thru 3/31/2020. The average number of days to sell is 61 days.
- The average sold price of $1.274M, is down 35% from 2019 and 51% above the 2009 low.
- The average sales price per sqft is $624, down 32% from 2019.
- There are eleven homes for sale, ranging in price from $1.29M to $3.35M.
- Number of sales and sales prices for 4Bed/3Bath homes is very choppy though there has been an erratic up trend in average sale price since 2013.
4 Bedroom/4 Bathroom
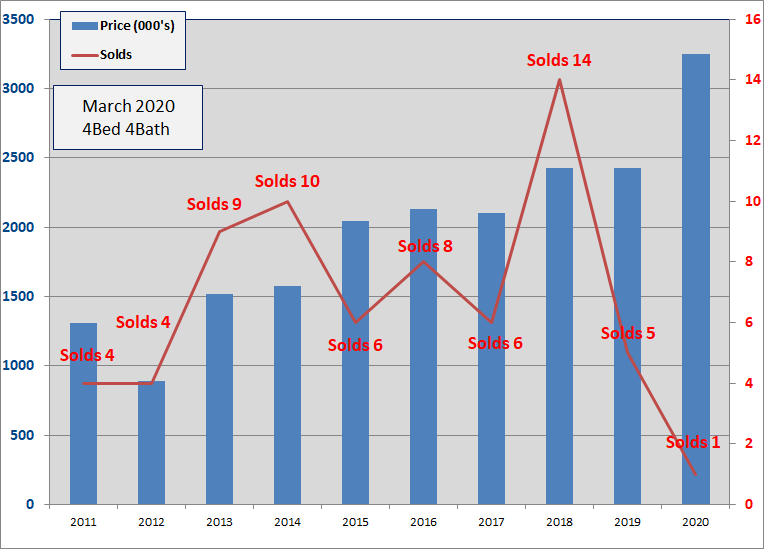
- One, 4Bed/4Bath home has sold in the Old Town area thru 3/31/2020. Five homes sold in 2019 at an average days on market of 52 days.
- There are ten 4/4's for sale ranging from $1.69M to $3.8M.
- The 2019 average sold price of $2.43M was the same as 2018 which was up 15% over 2017.
- The 2019 average sold price per sq.ft. of $1120 was up 23% over 2018. (Two of the sold houses were located in Truman Annex).
- Since 2003, average number of annual sales is six, with six in 2017, fourteen in 2018 and five in 2019. Despite the choppy number of sales, price action has been steady, $2M - $2.4M.
Summary
1st Qtr 2020 Old Town Key West home sales are well within the range of 1st Qtr sales in 2016, 2017, 2018 and 2019. No month of the quarter was appreciably above or below any monthly, quarterly or annual benchmark. Prices too were steady as each month had an average sold price above $1M with February and March both topping $1.4M. (Sold prices for thirteen of the last fifteen months have averaged over $1M).
Inventory is down slightly but beautiful, well constructed properties are available. Proactive Realtors are making best use of virtual tours, videos, virtual showings and multiple social medial sites to display their property.
In the near term sales will likely stumble as there are only 8 Contingent and Pending properties in the pipeline.
Of a positive note, 53% of sales in the Quarter were in Cash. This is slightly above the 5-year average. Nine of the thirteen sales in March were in Cash with sold prices ranging from $4.7M to $600,000.
Conclusion
No one knows for sure. I'm anticipating a sort of a "U" recovery with a base of unknown, hopefuly only multi-month duration. I am well impressed with the flexibility of corporate America to shift to the production of needed goods and services. As I wrote in my All Hands on Deck, my faith is in the combined forces of the public and private sectors to keep Americans safe, recovering and released from fear.
For this present situation, Key West is blessed in its relative isolation, warm skies and daily easterlies of clean refreshing air. We are saddened at the pain of others and empathize clearly the misery suffered when it is your sad turn in the barrel. There is no other solution than to reef sail, come close to the wind and keep your head about you.
If you have any questions or comments, please contact me here.
Good luck!
Additional Resources: