Twenty single family homes sold in the Old Town area in January, the BIGGEST January ever. Twenty sales is double the 5 year (2016 - 2020) January average of ten sales, matched December 2020's record of twenty and, after tepid sales in the 2nd and 3rd Qtrs 2020, was the fifth month in a row of accelerating sales. On prices, the average sales price of $1.685M was the highest figure since October 2019 (with only seven sales). The average sales price per square foot of $871 topped the end of 2020 figure of $777 by 12% and topped the 5-year annual average of $713 by 22%. Wow.
____________________________________________________________________________________
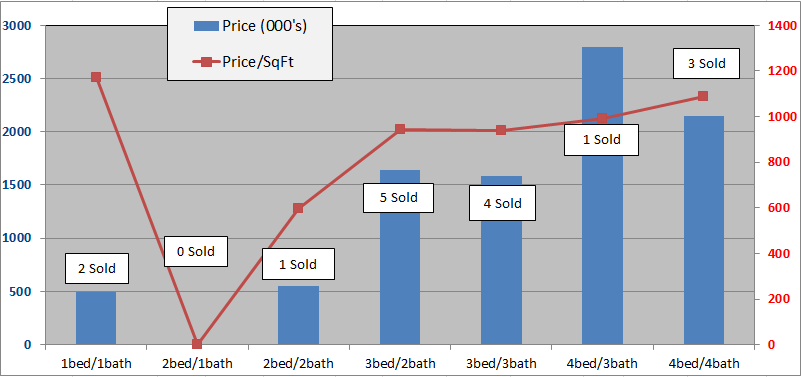
The below charts show sales of the seven most popular bed/bath combinations in Old Town Key West from January 1, 2012 to January 31, 2021. When there is a difference between total home sales and the sum of sales in the below seven charts it is because of a sale of, for instance, a 2bed/3bath or 3bed/1bath house or a house with more than four bedrooms.
These charts are for single family homes sold south and west of White St. and cover the six neighborhoods of The Meadows, Old Town North and South, Bahama Village, Truman Annex and Casa Marina but not Sunset Key. You can view a map of the six neighborhoods of Old Town here. A neighborhood by neighborhood analysis of full year 2020 sales, is here.
The seven bed/bath combinations below contain enough sales to measure and evaluate trends after the 2004-2006 real estate Bubble.
One Bedroom/One Bathroom
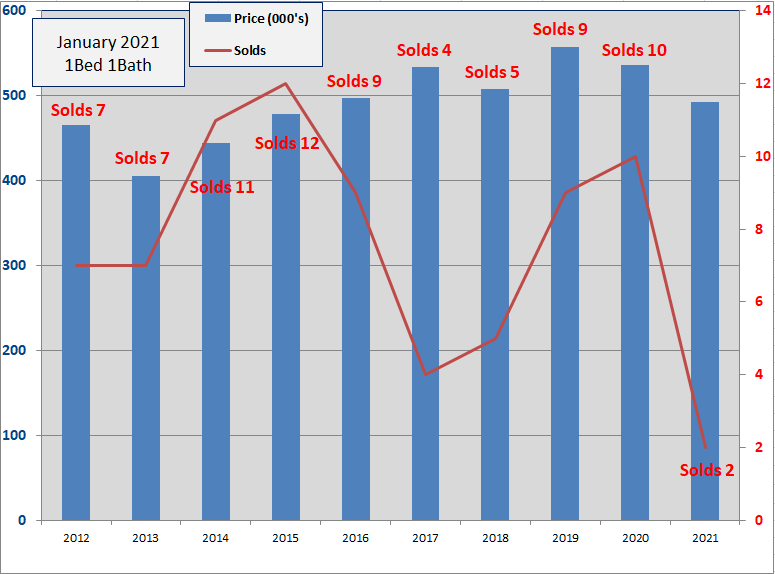
- Two, 1Bed/1Bath homes have sold in the Old Town area thru 1/31/2021. The average number of days to sell is 39 days.
- There are three 1/1 homes for sale priced between $608K and $699K.
- The 2021 average sale price of $493,000 is 8% less than the average sale price for 2020 and 153% above the 2011 low.
- In 2020 there were ten sales, the best since 2015 when twelve homes sold.
- The average size of the 2021 homes sold is 420sq.ft., well below average. The average sale price per sqft. of $1173 is 40% above 2020.
Two Bedroom/One Bathroom
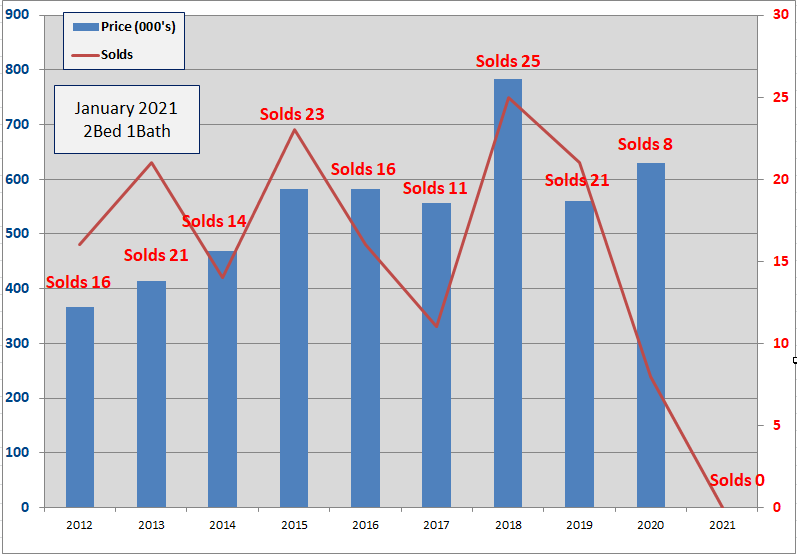
- Zero, 2Bed/1Bath homes have sold in the Old Town area thru 1/31/2021.
- In 2020, the average Sold price of $629,000 was 12% above 2019 which at $560K was down 29% from 2018. The $629K was 89% above the 2011 low.
- Five 2/1 homes are for sale with prices from $649K to $949K.
- Twenty-one homes sold in 2019, eight in 2020.
- Since 2009, 2Bed/1Bath homes have been the 3rd most popular selling home in Old Town with 211 sales
Two Bedroom/Two Bathroom
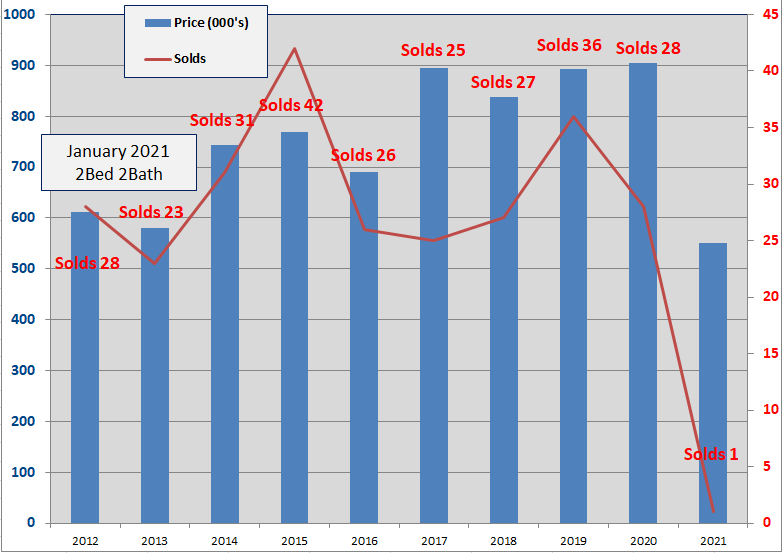
- One, 2Bed/2Bath home sold in the Old Town area thru 1/31/2021. The number of Days to sell is 67 Days.
- The sold price of $550,000 is 39% lower than the 2020 end of year price of $905, which was the highest average sold price since 2006 and was 113% above the low in 2009.
- Twelve 2/2's are for sale, priced between $879K and $1.439M.
- The 2021 average Sold price per sqft is $595, down 23% from 2020. In 2019 the average was $724, in 2018 the average was $747.
- Since 2009, 2Bed/2Bath homes have been the biggest sellers in Old Town Key West with 350 sales
Three Bedroom/Two Bathroom
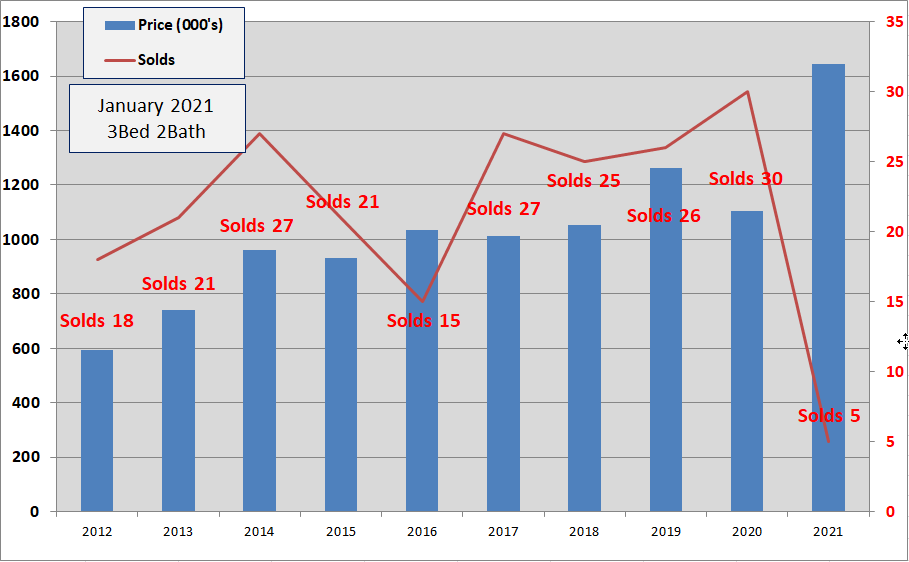
- Five, 3Bed/2Bath homes have sold in the Old Town area thru 1/31/2021. The average number of Days to sell is 59 Days.
- The average Sold price of $1,645,000 is up 49% over 2020 and is 257% above the 2009 low.
- The average sold price per sqft. is $944, up 28% over 2020.
- Twenty-six homes sold in 2019, thirty in 2020, the most ever.
- Since 2009, 3Bed/2Bath homes have been the 2nd biggest sellers in Old Town, exceeding twenty sales every year since 2013 except in 2016. Total sales since 2009 is 266 sales
Three Bedroom/Three Bathroom
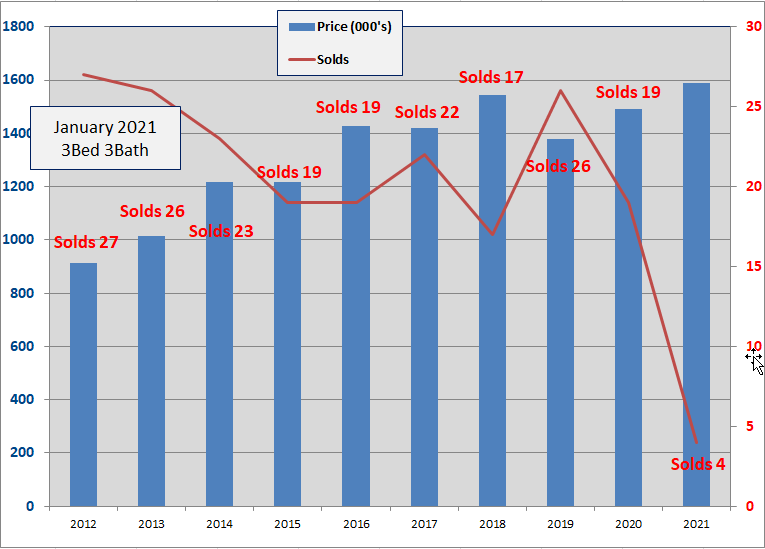
- Four, 3Bed/3Bath homes have sold in the Old Town area thru 1/31/2021. The average number of Days to sell is 26 Days.
- The 2021 average sold price of $1.588M is 6% above 2020 which was 8% over 2019. $1.588M is 115% above the 2010 low.
- The average Sold price per sqft. of $937 is up 1% from 2020 and is the highest recorded for 3/3 homes.
- Twenty-six homes sold in 2019 and nineteen in 2020.
- Since 2009, 3Bed/3Bath homes have been the fourth biggest seller in Old Town Key West with 222 sales.
Four Bedroom/Three Bathroom
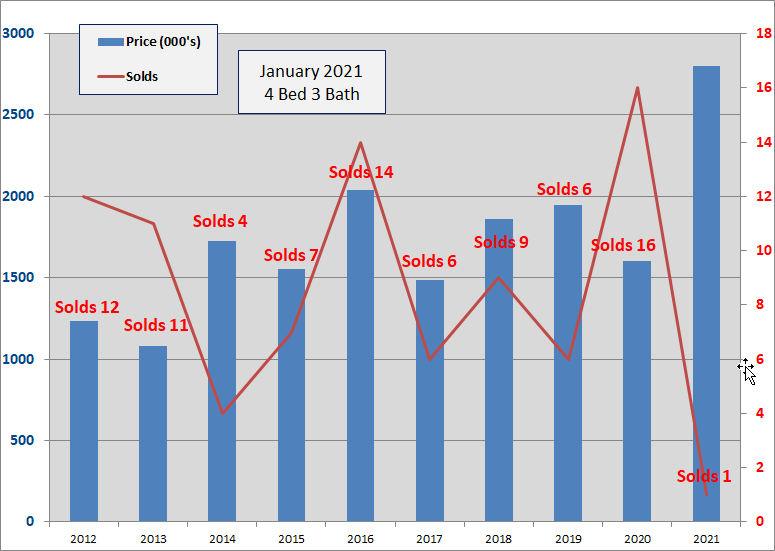
- One, 4bed/3bath home sold in the Old Town area thru 1/31/2021. The number of days to sell is 40 days.
- The average sold price of $2.8M, is up 75% from 2020 and is 231% above the 2009 low.
- Sixteen 4/3's sold in 2020, more than 2019 and 2018 combined. Sixteen solds is the highest annual total since seventeen sold in 2008!
- The 2021 sales price per sqft of $993 up 36% over 2020.
- There are seven homes for sale, ranging in price from $1.439M to $3.3995M.
- Number of sales and sales prices for 4Bed/3Bath homes is very choppy though there has been an erratic up trend in average sale price since 2013.
Four Bedroom/Four Bathroom
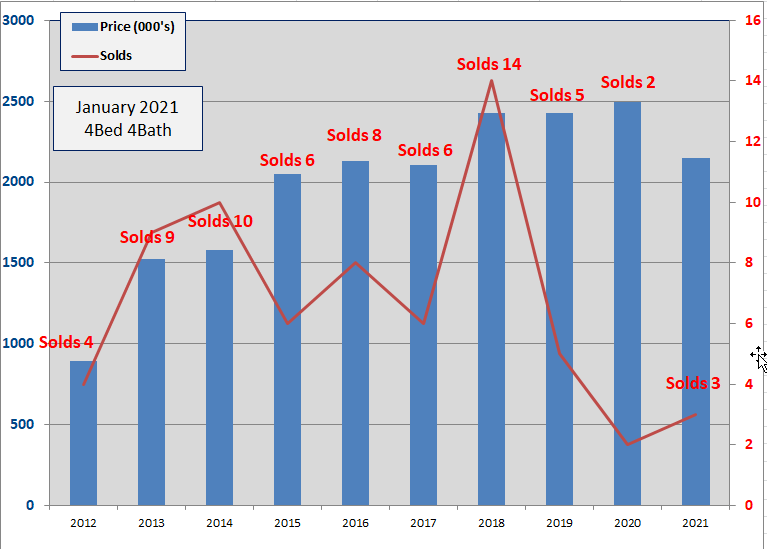
- Three, 4Bed/4Bath homes have sold in the Old Town area thru 1/31/2021. Average number of Days to sell is 38 days. Two homes sold in 2020 at an average days on market of 114 days.
- There are ten 4/4's for sale ranging from $1.99M to $3.9M.
- The 2021 average sold price of $2.148 is down 14% from 2020 which was up 3% over 2019 and is up 124% over the 2009 low.
- The 2021 average sold price per sq.ft. of $1089 is down 3% from 2020.
- Since 2003, average number of annual sales is six, with fourteen in 2018, five in 2019 and two in 2020. Despite the choppy number of sales, price action has been steady, $2M - $2.4M.
Summary
Pick any reason you want to buy Key West; escape metropolitan turmoils, work remote yet fly any place you want with ease, historic architecture, environmentally friendly, bicycle transportation, no diversity, race or tolerance issues ...
Giving in to fear and uncertainties could mean missing out on the positives of buying Key West real estate. 50% of the sales in January were cash buyers. (47% for all of 2020). The other half knows their ability to borrow and service debt at a very low cost (interest rates) matters more than their absolute level of debt.
In 2020, the average Days on Market (DOM) for the seven configurations tracked here was 106 days. DOM begins on the date of Listed for Sale and ends on the date of Closing. This means in approximately two months, subtract days to secure financing, 142 Sellers found a Buyer willing to spend an average of $1.284M for their property. Its like Love.
If you have any comments or questions, please contact me here.
Welcome to 2021. Good luck!
Additional sources: