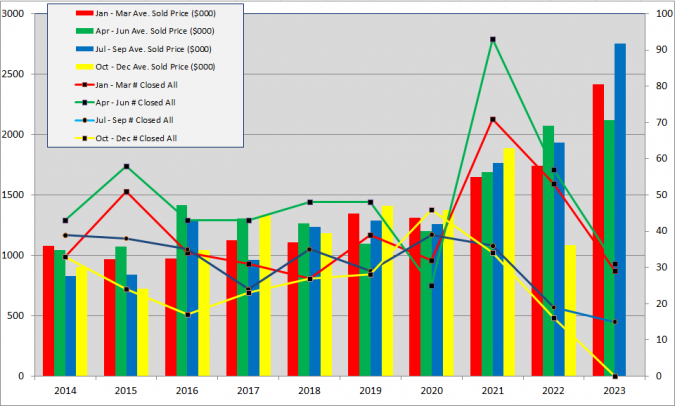
Six single family homes sold in Old Town Key West in September, bringing 3rd Qtr 2023 sales to a total of 15 which is the fewest number of sales for any Quarter ever. Total sales Jan-Sep is seventy-five, 35% behind the 5-year (2018-2022) average of Jan-Sep sales, 42% behind Jan-Sep 2022, 63% behind Jan-Sep 2021 and 22% behind Jan-Sep 2020. Q3 2023 is the 9th consecutive Qtr where sales were less than the respective Qtr of the previous year. On Prices, the average Sold price of the six homes sold in September was $3.725M, bringing the average Sold price Jan-Sep to $2.43M, up 42% YTD. The average Sold price per square feet Jan-Sep of $1274 is up 9% YTD and is up 33% over 2021.
________________________________________________________________________________________
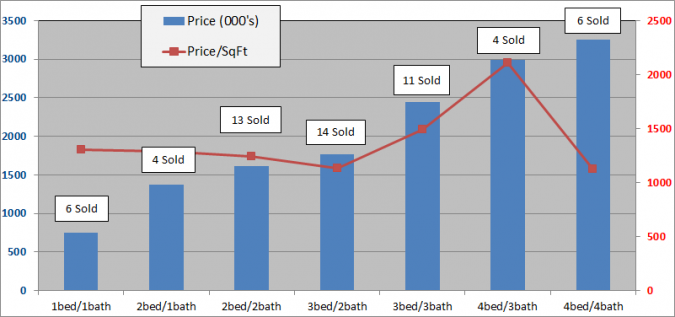
The below charts show sales of the seven most popular bed/bath combinations in Old Town Key West from January 1, 2014 to September 30, 2023. When there is a difference between total home sales and the sum of sales in the below seven charts it is because of a sale of, for instance, a 2bed/3bath or 3bed/1bath house or a house with more than four bedrooms.
These charts are for single family homes sold south and west of White St. and cover the six neighborhoods of The Meadows, Old Town North and South, Bahama Village, Truman Annex and Casa Marina but not Sunset Key. You can view a map of the six neighborhoods of Old Town here. An analysis of the number of sales and sale prices for each of these six neighborhoods for the 1st half of 2023 is here.
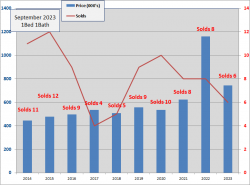
1Bedroom/1 Bathroom
- Six,1Bed/1Bath homes have sold in the Old Town area thru 9/30/2023. Average days on market was 27 days. For all 2022, eight homes sold at an average number of days to sell of 60 days.
- The average Sold price for the six 2023 sales is $745K which is down 36% from 2022 yet 282% above the 2011 low. In 2022, the average sale price for the 8 sales was $1.16M, highest ever.
- There are four 1/1's for sale priced at $600K and $1.25M.
- The 2023 sales have an average size of 572 sqft at $1303 per sqft. In 2022, the average size was 789 sq.ft. and the average sale price per sqft. of $1471 was highest ever.
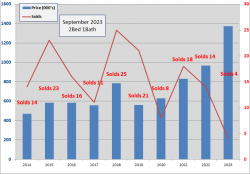
2 Bedroom/1 Bathroom
- Four, 2Bed/1Bath homes have sold in the Old Town area thru 9/30/2023 in an average of 62 days to sell. For all 2022, fourteen homes sold at an average of 42 days to sell.
- The 2023 average sold price of $1.374M is up 42% over 2022 and 314% above the 2011 low.
- The sold price per square foot in 2023 of $1286 is up 19% over 2022 and is the highest ever.
- There are three 2/1 homes for sale priced between $1.3M and $1.4M.
- Since 2009, 2Bed/1Bath homes have been the 3rd most popular selling home in Old Town with 247 sales
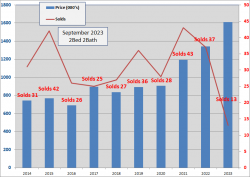
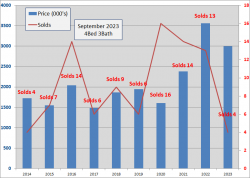
2 Bedroom/2 Bathroom
- Thirteen, 2Bed/2Bath homes have sold in the Old Town area thru 9/30/2023 with an average of 52 days on market. For all 2022, thirty-seven homes sold at an average of 45 days to sell.
- The 2023 average Sold price of $1.61M is up 20% over 2022 and 279% above the low in 2009.
- Six 2/2's are for sale, priced between $629K and $3.39M.
- The 2023 average Sold price per sqft of $1239 is up 12% over 2022.
- Since 2009, 2Bed/2Bath homes have been the biggest sellers in Old Town Key West with 442 sold.
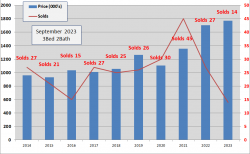
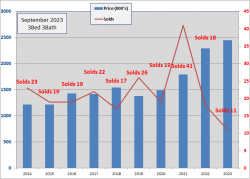
3 Bedroom/2 Bathroom
- Fourteen, 3Bed/2Bath homes have sold in the Old Town area thru 9/30/2023. The average number of Days to sell is 83 Days.
- The average Sold price of $1.769M is up 4% from 2022 and is 284% above the 2009 low.
- The average sold price per sqft. is $1136, down 1% from 2022.
- Twenty-seven 3/2 homes sold in 2022, 3rd most ever.
- Since 2009, 3Bed/2Bath homes have been the 2nd biggest sellers in Old Town, exceeding twenty sales every year since 2013 except in 2016. Total sales since 2009 is 347 sales.
3 Bedroom/3 Bathroom
- Eleven, 3Bed/3Bath homes have sold in the Old Town area thru 9/30/2023 at an average of 101 Days to sell. For all 2022, 18 homes sold at an average of 40 Days, fastest ever.
- The 2023 average sold price of $2.45M is up 7% from 2022 and 232% above the 2010 low.
- The average Sold price per sqft. of $1491 is up 22% over 2022.
- Forty-one homes sold in 2021, nineteen homes sold in 2020.
- Since 2009, 3Bed/3Bath homes have been the fourth biggest seller in Old Town Key West with 288 sales
4 Bedroom/3 Bathroom
- Four, 4bed/3bath homes have sold in the Old Town area thru 9/30/2023 at an average of 49 Days to sell. For all 2022, 13 homes sold at an average of 66 days to sell.
- The 2023 average sold price of $2.99M is down 16% from 2022 and is 254% above the 2009 low.
- The 2023 average sales price per sq.ft. of $2111, highest ever, is up 49% over 2022.
- There are four 4/3 homes for sale priced between $3.2M and $4.895M.
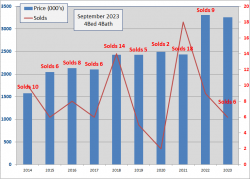
4 Bedroom/4 Bathroom
- Six, 4Bed/4Bath homes have sold in the Old Town area thru 9/30/2023 at an average of 38 days to sell. For all 2022, nine homes sold at an average 49 days.
- The 2023 average sold price of $3.26M is down 2% from 2022 and is up 193% over the 2009 low.
- The 2023 average sold price per sq.ft. of $1121 is down 13% from 2022.
- Since 2003, the average number of annual sales is six, with nine in 2022, eighteen in 2021 and two in 2020.
- Despite the choppy number of sales, price action has steadily climbed from $2.M in 2015 to $3.3M in 2022.
Summary
Inventory of homes for sale, 43, has fallen to its lowest level since December 2022. Of these 43 homes:
- Under $1M - 3
- $1M - $1.5M - 10
- $1.5M - $2M - 7
- $2M - $2.5M -5
- $2.5M - $3M - 3
- Over $3M - 15
Cash sales occur throughout the price range and remain dominant at 68% for all sales Jan-Sep.
As of October 2023, there are 4 Contingent and 5 Pending indicating a slow start to the 4th Qtr which has traditionally been the slowest Qtr with 19% of annual sales..
Conclusion
Of the 75 homes sold January - September:
- Twenty-five homes, or 33%, have been bought by people who already live in Key West or use their new Key West home as their address.
- Fifty homes, or 66%, have been bought by people who do not live in Key West. Thirteen live elsewhere in Florida and thirty-seven live outside of Florida.
- Zero international buyers
Since I began real estate in 2001, approximately 62% - 64% of property owners in Old Town have been non-Key Westers so the 66% figure is not widely out of line with historic averages. Of note, buyers from mid-April through September were overwhelmingly not from Key West.
If you have any comments or questions, please contact me here.
Good luck!
Truman Annex Waterfront Park
Additional Sources:


