Fifteen single family homes sold in the Old Town Key West area in June bringing the 1st Half total to 110 sales, the second highest number of 1st Half sales ever and 21% above the 5-year (2017-2021) 1st Half average of 91 sales. Every month Jan - June in 2022 exceeded its 5-year average of sales except May. The 110 sales trails 2021's record 1st Half by 33% but exceeds 2020 by 93% and 2019 by 26%. On Prices, the average sales price for June of $2.54M brought the averages sales price for the 1st Half of 2022 to $2.07M, the highest ever for the 1st Half of any year. The average sales price per foot for the 110 sales is a record $1169.
________________________________________________________________________________________
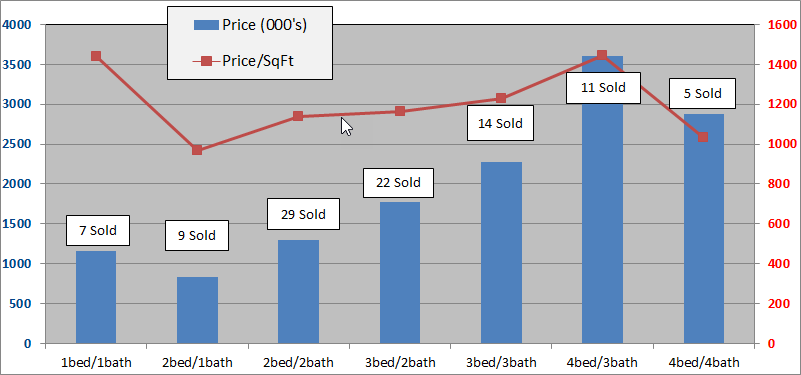
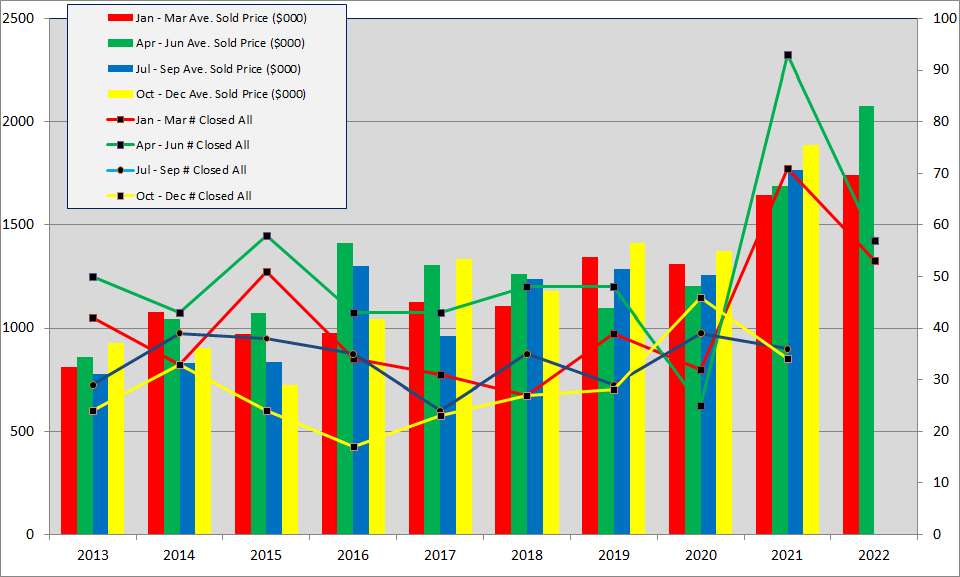
The below charts show sales of the seven most popular bed/bath combinations in Old Town Key West from January 1, 2013 to June 30, 2022. When there is a difference between total home sales and the sum of sales in the below seven charts it is because of a sale of, for instance, a 2bed/3bath or 3bed/1bath house or a house with more than four bedrooms.
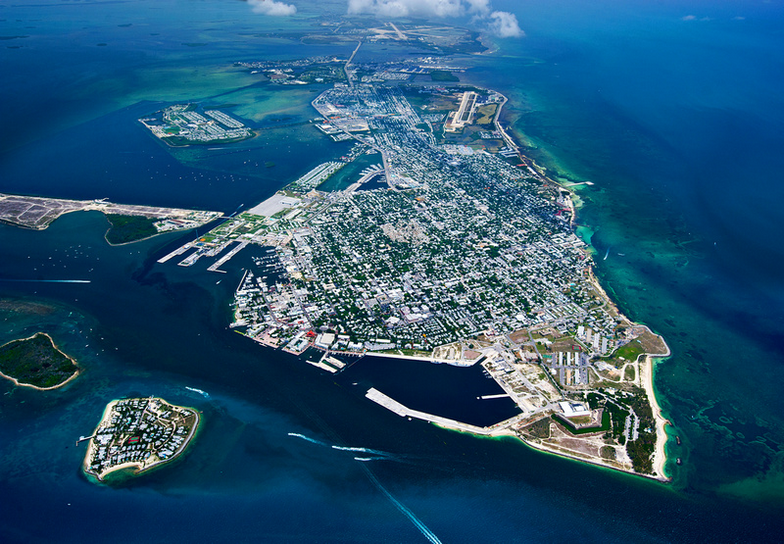
These charts are for single family homes sold south and west of White St. and cover the six neighborhoods of The Meadows, Old Town North and South, Bahama Village, Truman Annex and Casa Marina but not Sunset Key. You can view a map of the six neighborhoods of Old Town here. An analysis of the number of sales and sale prices for each of these six neighborhoods for the 1st Half of 2022 is here.
1 Bedroom/1 Bathroom
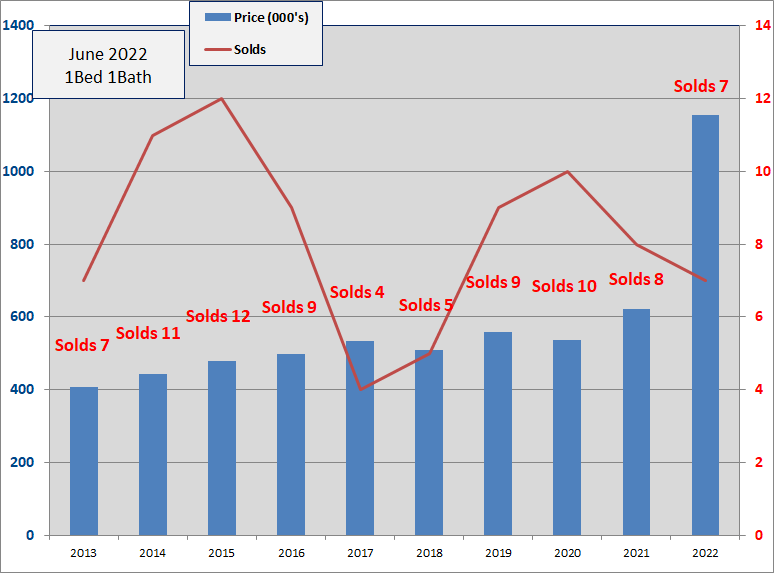
- Seven, 1Bed/1Bath homes have sold in the Old Town area thru 6/30/2022. The average number of days to sell is 89 days.
- The 2022 average sale price of $1.155M is up 86% over 2021 and is 492% above the 2011 low.
- Eight homes sold in 2021, ten homes in 2020.
- The average size of the 2022 homes sold is 803 sq.ft., well above average.
- The average sale price per sqft. of $1437 is up 33% over 2021 and is the highest ever.
2 Bedroom/1 Bathroom
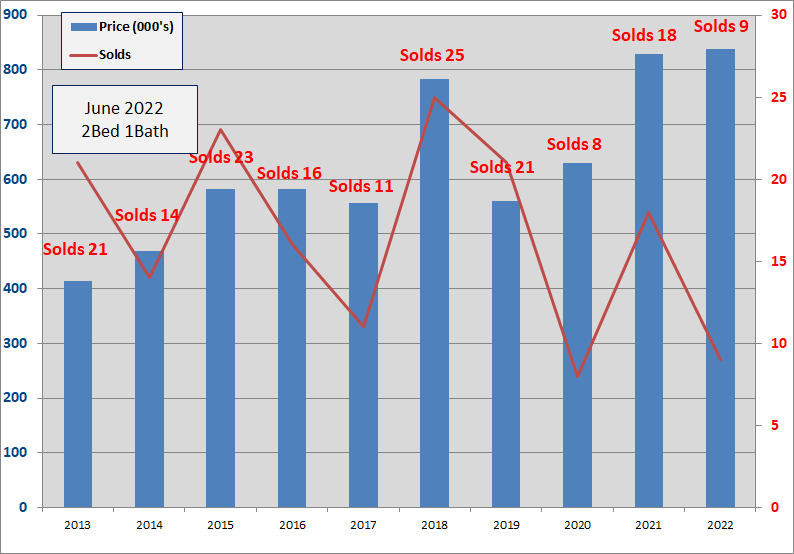
- Nine, 2Bed/1Bath homes have sold in the Old Town area thru 6/30/2022 at an average of 48 days to sell.
- The 2022 average sold price is $838K up 1% over 2021. The $838K is 153% above the 2011 low.
- The sold price per square foot in 2022 of $967 is up 14% over 2021 and is the highest ever for a 2/1.
- One 2/1 home is for sale at $1.5M.
- Eighteen 2/1 homes sold in 2021, eight in 2020.
- Since 2009, 2Bed/1Bath homes have been the 3rd most popular selling home in Old Town with 238 sales
2 Bedroom/2 Bathroom
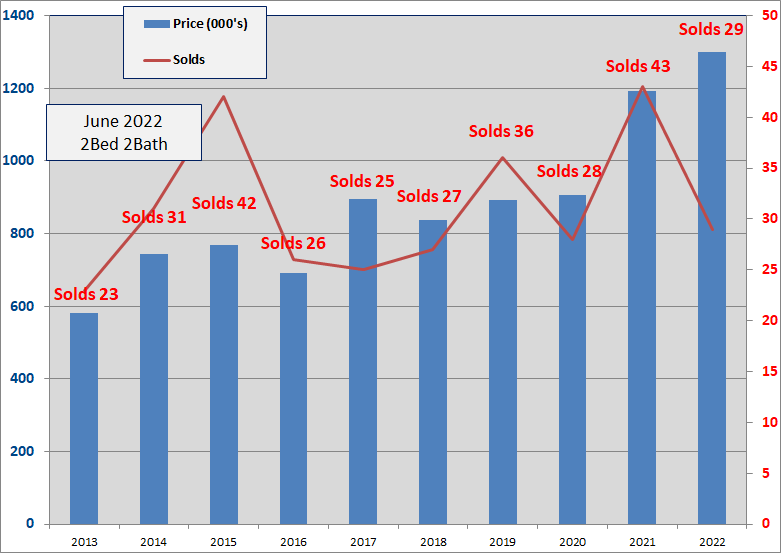
- Twenty-nine, 2Bed/2Bath homes have sold in the Old Town area thru 6/30/2022. The average number of Days to sell is 32 Days. 43 homes sold in 2021 at an average of 58 Days.
- The 2022 average sold price of $1.3M is up 9% over 2021 and is the highest ever average sold price. $1.3M is 206% above the low in 2009.
- Seven 2/2's are for sale, priced between $919K and $2M.
- The 2022 average Sold price per sqft is $1137, up 17% over 2021 and is the highest ever.
- Since 2009, 2Bed/2Bath homes have been the biggest sellers in Old Town Key West with 421 sales
3 Bedroom/2 Bathroom
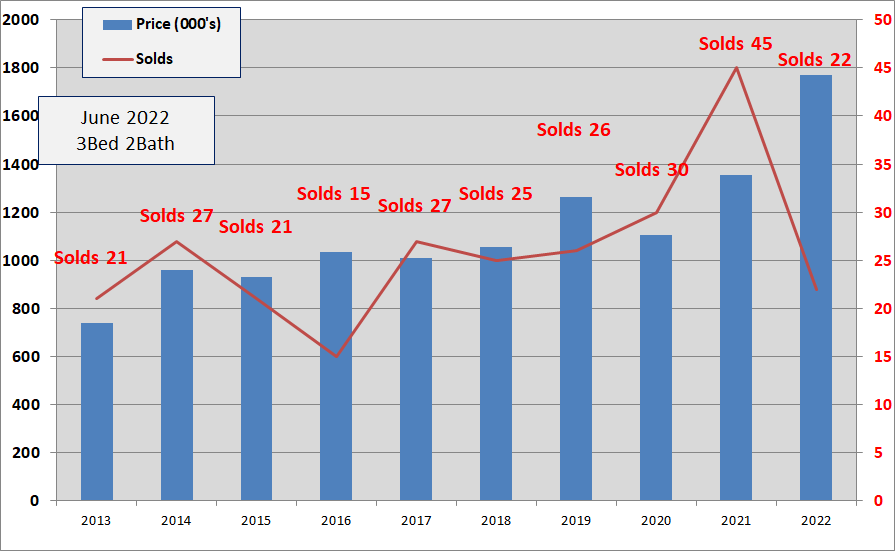
- Twenty-two, 3Bed/2Bath homes have sold in the Old Town area thru 6/30/2022. The average number of Days to sell is 34 Days.
- The average Sold price of $1.77M is up 31% over 2021 and is the highest ever for a 3/2 home. The $1.77M is 284% above the 2009 low.
- The average sold price per sqft. is $1165, up 25% over 2021.
- Forty-five 3/2 homes sold in 2021, the most ever.
- Since 2009, 3Bed/2Bath homes have been the 2nd biggest sellers in Old Town, exceeding twenty sales every year since 2013 except in 2016. Total sales since 2009 is 328 sales.
3 Bedroom/3 Bathroom
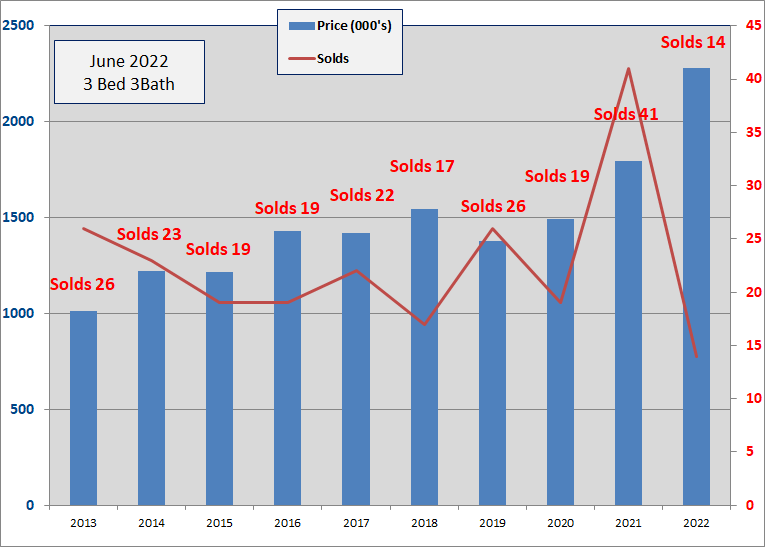
- Fourteen, 3Bed/3Bath homes have sold in the Old Town area thru 6/30/2022. The average number of Days to sell is 44. In 2021, 41 homes sold, the most ever, at an average of 96 Days.
- The 2022 sold price of $2.28M is up 27% over 2021 and is 209% above the 2010 low.
- The average Sold price per sqft. of $1230 is up 23% over 2021.
- Forty-one homes sold in 2021, nineteen homes sold in 2020.
- Since 2009, 3Bed/3Bath homes have been the fourth biggest seller in Old Town Key West with 273 sales.
4 Bedroom/3 Bathroom
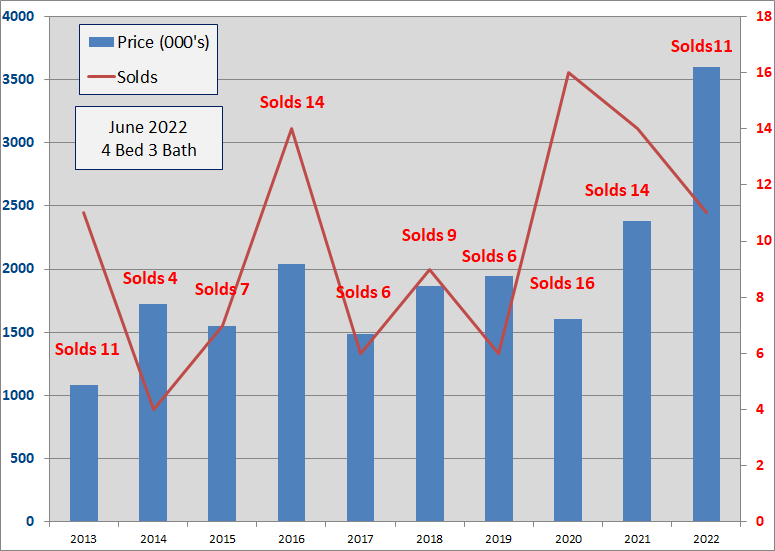
- Eleven, 4bed/3bath homes have sold in the Old Town area thru 6/30/2022 at an average of 66 Days to sell. In 2021, 14 homes sold at an average number of days to sell of 95 Days.
- The 2022 average sold price is $3.59M, up 51% over 2021 which was 49% above 2020 and is 326% above the 2009 low.
- The 2022 average sales price per sqft of $1442 is up 43% over 2021 and is the highest ever.
- Number of sales and sales prices for 4Bed/3Bath homes is very choppy though there has been an erratic up trend in average sale price since 2013.
4 Bedroom/4 Bathroom

- Five, 4Bed/4Bath homes have sold in the Old Town area thru 6/30/2022. Average number of Days to sell is 67 Days. In 2021, 18 homes sold, the most 4/4's solds EVER.
- The 2022 sold price of $2.875M is up 18% over 2021 and is up 158% over the 2009 low.
- The 2022 sold price per sq.ft. of $1035 is up 8% over 2021.
- Since 2003, the average number of annual sales is six, with eighteen in 2021, two in 2020 and five in 2019.
- Despite the choppy number of sales, price action has been steady between $2.1M - $2.5M.
Summary
Old Town homes continue to generate enormous goodwill. The June 2021 - June 2022 Year over Year (YOY) sale prices are:
- 1 Bed/1 Bath - Up 126%
- 2 Bed/1 Bath - Flat
- 2 Bed/2 Bath - Up 23%
- 3 Bed/2 Bath - Up 32%
- 3 Bed/3 Bath - Up 34%
- 4 Bed/3 Bath - Up 57%
- 4 Bed/4 Bath - Up 19%
Slowdown? As of 1 July 2022, there are 13 Contingent and Pending contracts. Assuming a failed contract or two and a walk-in Cash buyer or two, 13 is our given.
The 5-year average number for sales in July is 14, for August it is 10, September is 8. During the 1st Qtr of 2022 there were on average at any time two months worth of Contingent and Pending contracts in-hand. That number of contracts in-hand has slowly decreased during the 2nd Qtr to one month.
Conclusion
From 2017 - 2022, cash sales have averaged 54% per year. An uncertain stock market will likely cause a pause in cash sales as buyer/investors wait to re-establish their stock portfolios.
The remaining 46% who finance will likely also delay their purchase as their costs of living are impacted by the unknowns of inflation and purchasing power.
Both groups, though financers more so as they have no options, are impacted by the rising costs of flood and wind insurance. The introduction of FEMA's Risk Rating 2.0 flood insurance in April has had less of a negative impact on the market as some naysayers had predicted. Second, increased scrutiny on the complete wind insurance market from Tallahassee gives many hope that the wind market will soon become less litigious and more open to competition from private carriers.
If you have any comments or questions, please contact me here.
Good luck.